UNITED STATES
SECURITIES AND EXCHANGE COMMISSION
Washington, D.C. 20549
FORM 10-K
ANNUAL REPORT PURSUANT TO SECTION 13 OR 15(d)
OF THE SECURITIES EXCHANGE ACT OF 1934
For the Fiscal Year Ended December 31, 2019 Commission File Number: 0‑3676
VSE CORPORATION
(Exact Name of Registrant as Specified in its Charter)
DELAWARE | 54-0649263 |
(State or Other Jurisdiction of Incorporation or Organization) | (I.R.S. Employer Identification No.) |
6348 Walker Lane | ||||
Alexandria, Virginia | 22310 | |||
(Address of Principal Executive Offices) | (Zip Code) | |||
Registrant's Telephone Number, Including Area Code: (703) 960-4600
Securities registered pursuant to Section 12(b) of the Act:
Title of each class | Trading Symbol | Name of each exchange on which registered | ||
Common Stock, par value $0.05 per share | VSEC | The NASDAQ Global Select Market | ||
Securities registered pursuant to Section 12(g) of the Act: None
Indicate by check mark if the registrant is a well-known seasoned issuer, as defined in Rule 405 of the Securities Act. Yes [ ] No
[x]
Indicate by check mark if the registrant is not required to file reports pursuant to Section 13 or Section 15(d) of the Act. Yes [ ] No [x]
Indicate by check mark whether the registrant (1) has filed all reports required to be filed by Section 13 or 15(d) of the Securities Exchange Act of 1934 during the preceding 12 months (or for such shorter period that the registrant was required to file such reports), and (2) has been subject to such filing requirements for the past 90 days. Yes [x] No [ ]
Indicate by check mark whether the registrant has submitted electronically every Interactive Data File required to be submitted and posted pursuant to Rule 405 of Regulation S-T (section 232.405 of this chapter) during the preceding 12 months (or for such shorter period that the registrant was required to submit and post such files).
Yes [x] No [ ]
Indicate by check mark whether the registrant is a large accelerated filer, an accelerated filer, a non-accelerated filer, or a smaller reporting company. See definition of "large accelerated filer," "accelerated filer" and "smaller reporting company" in Rule 12b-2 of the Exchange Act.
Large accelerated filer [ ] Accelerated filer [x] Non-accelerated filer [ ] Smaller reporting company [ ]
If an emerging growth company, indicate by check mark if the registrant has elected not to use the extended transaction period for complying with any new or revised financial accounting standards provided pursuant to Section 13(a) of the Exchange Act. Yes [ ] No [ ]
Indicate by check mark whether the registrant is a shell company (as defined in Rule 12b-2 of the Act). Yes [ ] No [x]
The aggregate market value of outstanding voting stock held by non-affiliates of the Registrant as of June 30, 2019, was approximately $251 million based on the last reported sales price of the registrant's common stock on the NASDAQ Global Select Market (the "NASDAQ") as of that date.
Number of shares of Common Stock outstanding as of February 26, 2020: 10,986,223.
DOCUMENTS INCORPORATED BY REFERENCE
Portions of Registrant's definitive proxy statement for the Annual Meeting of Stockholders expected to be held on May 6, 2020, are incorporated herein by reference into Part III of this report.
-1-
TABLE OF CONTENTS | ||
Page | ||
ITEM 1 | ||
ITEM 1A | ||
ITEM 1B | ||
ITEM 2 | ||
ITEM 3 | ||
ITEM 4 | ||
ITEM 5 | ||
ITEM 6 | ||
ITEM 7 | ||
ITEM 7A | ||
ITEM 8 | ||
ITEM 9 | ||
ITEM 9A | ||
ITEM 9B | ||
ITEM 10 | ||
ITEM 11 | ||
ITEM 12 | ||
ITEM 13 | ||
ITEM 14 | ||
ITEM 15 | ||
-2-
Forward Looking Statements
This Annual Report on Form 10-K ("Form 10-K") contains statements that, to the extent they are not recitations of historical fact, constitute "forward looking statements" within the meaning of Section 27A of the Securities Act of 1933, as amended (the “Securities Act”), and Section 21E of the Securities Exchange Act of 1934, as amended (the “Exchange Act”). All such statements are intended to be covered by the safe harbor provisions for forward-looking statements contained in the Private Securities Litigation Reform Act of 1995 and includes this statement for purposes of such safe harbor provisions.
“Forward-looking” statements, as such term is defined by the Securities Exchange Commission (the “SEC”) in its rules, regulations and releases, represent our expectations or beliefs, including, but not limited to, statements concerning our operations, economic performance, financial condition, growth and acquisition strategies, investments and future operational plans. Without limiting the generality of the foregoing, words such as “may,” “will,” “expect,” “believe,” “anticipate,” “intend,” “forecast,” “seek,” “plan,” “predict,” “project,” “could,” “estimate,” “might,” “continue,” “seeking” or the negative or other variations thereof or comparable terminology are intended to identify forward-looking statements. These statements, by their nature, involve substantial risks and uncertainties, certain of which are beyond our control, and actual results may differ materially depending on a variety of important factors, including, but not limited to, those identified in “Item 1A. Risk Factors” in this Form 10-K. All forward-looking statements made herein are qualified by these cautionary statements and risk factors and there can be no assurance that the actual results, events or developments referenced herein will occur or be realized.
Readers are cautioned not to place undue reliance on these forward looking-statements, which reflect management's analysis only as of the date hereof. The Company undertakes no obligation to publicly revise these forward-looking statements to reflect events or circumstances that occur or arise after the date hereof.
-3-
PART I
ITEM 1. Business
History and Organization
VSE Corporation (“VSE,” the “Company,” “we,” “us,” or “our”) is a diversified products and services aftermarket company providing repair services, distribution, logistics, supply chain management support and consulting services for land, sea and air transportation assets in the public and private sectors. We serve the United States Government (the "government"), including the United States Department of Defense ("DoD"), federal civilian agencies, as well as commercial and other customers. Our operations include parts supply and distribution, and maintenance, repair, and overhaul (“MRO”) services for ground transport and aviation component and accessories; vehicle and equipment refurbishment; logistics; engineering; IT and health care IT solutions; and energy and management consulting services.
VSE was incorporated in Delaware in 1959 and the parent company serves as a centralized managing and consolidating entity for our three operating groups, each of which consists of one or more wholly owned subsidiaries or unincorporated divisions that perform our services. Our operating segments include the Aviation Group, Supply Chain Management Group, and Federal Services Group. The term "VSE" or "Company" means VSE and its operating businesses unless the context indicates operations of only VSE as the parent company.
Revenues (in thousands) Years ended December 31, | |||||||||||||||||
2019 | % | 2018 | % | 2017 | % | ||||||||||||
Aviation Group | $ | 224,546 | 30 | $ | 145,423 | 21 | $ | 134,809 | 18 | ||||||||
Supply Chain Management Group | 214,520 | 28 | 214,809 | 31 | 214,542 | 28 | |||||||||||
Federal Services Group | 313,561 | 42 | 336,986 | 48 | 410,762 | 54 | |||||||||||
$ | 752,627 | 100 | $ | 697,218 | 100 | $ | 760,113 | 100 | |||||||||
Aviation Group
Our Aviation Group provides international parts supply and distribution, supply chain solutions, and component and engine accessory MRO services supporting global aftermarket commercial and business and general aviation customers through product distribution and MRO services. This business offers a range of services to a diversified global client base of commercial airlines, regional airlines, cargo transporters, MRO integrators and providers, aviation manufacturers, corporate and private aircraft owners, and fixed-base operators ("FBOs"). The Aviation Group generated approximately 30% of our consolidated revenues in 2019. This group did not have any one client that comprised more than 10% of our consolidated revenues in 2019.
Supply Chain Management Group
Our Supply Chain Management Group provides parts supply, inventory management, e-commerce fulfillment, logistics, data management, and other services to assist aftermarket commercial and federal customers with their supply chain management. Operations of this group are conducted by our wholly owned subsidiary Wheeler Bros., Inc., which supports the government and commercial truck fleets with parts, sustainment solutions and managed inventory services. Revenues for this business are derived from the sale of vehicle parts and mission critical supply chain services to support client truck fleets. The Supply Chain Management Group generated approximately 28% of our consolidated revenues in 2019. The United States Postal Service ("USPS") comprised approximately 22% of our consolidated revenues in 2019.
Federal Services Group
Our Federal Services Group provides aftermarket refurbishment and sustainment services to extend and maintain the life cycle of military vehicles, ships and aircraft for the DoD. The group provides foreign military sales services, engineering, logistics, maintenance, configuration management, prototyping, technology, and field support services to the DoD and other customers. We also provide energy consulting services and IT solutions to various DoD, federal civilian agencies and commercial clients. The Federal Services Group generated approximately 42% of our consolidated revenues in 2019. The foreign military sales program with the U.S. Department of Navy ("FMS Program") comprised approximately 12% of our consolidated revenues in 2019.
-4-
1st Choice Aerospace Acquisition
In January 2019, we acquired 1st Choice Aerospace Inc. ("1st Choice Aerospace"). 1st Choice Aerospace has operations in Florida and Kentucky and provides component MRO services and products for new generation and legacy commercial aircraft platforms. 1st Choice Aerospace is a subsidiary of VSE Aviation, Inc. under our Aviation Group. See Note (2) "Acquisition" to our Consolidated Financial Statements included below in Item 8 for additional information regarding our acquisition of 1st Choice Aerospace. 1st Choice Aerospace revenues for 2019 was approximately $63.0 million and 20% above our expectations driven primarily by expansion of service offerings.
Products and Services
We provide a broad array of capabilities and resources to support our clients’ aftermarket transportation assets, vehicle fleets, aircraft, systems, equipment and processes. We focus on creating value by sustaining and extending the life and improving the performance of our client assets through core offerings in supply chain management, parts supply and distribution, MRO, equipment refurbishment, logistics and engineering. We also provide IT solutions, health care IT, and consulting services.
Typical offerings include supply chain and inventory management services; vehicle fleet sustainment programs; vehicle fleet parts supply and distribution; MRO of aircraft components and engines accessories; aircraft engine and airframe parts supply and distribution; engineering support for military vehicles; military equipment refurbishment and modification; ship MRO and follow-on technical support; logistics management support; sustainable energy supply and electric power grid modernization projects, IT infrastructure and data management, and IT data services for health and public safety. See Item 7 “Management’s Discussion and Analysis of Financial Condition and Results of Operations” below for more information regarding our business.
Revenues and Contracts
Our revenues are derived from the delivery of products and from contract services performed for our customers. We offer our products and professional and technical services through various ordering agreements and negotiated and competitive contract arrangements.
Our Aviation Group revenues result from the sale of aircraft parts and performance of MRO services for private and commercial aircraft owners, aviation MRO providers, aviation original equipment manufacturers, and other clients. Revenues for the sale of aircraft parts are recognized at a point in time when control is transferred to the customer, which usually occurs when the parts are shipped. Revenues for MRO services are recognized over time as the services are transferred to the customer. MRO services revenue recognized is measured based on the cost-to-cost input method, as costs incurred reflect the work completed, and therefore the services transferred to date.
Our Supply Chain Management Group revenues result from the sale of aftermarket vehicle parts to government and commercial clients. We recognize revenue from the sale of vehicle parts when the customer takes ownership of the parts.
Our Federal Services Group revenues result from professional and technical services that are performed for customers on a contract basis. Revenue is recognized for performance obligations over time as we transfer the services to the customer. The three primary types of contracts used are cost-type, fixed-price, and time and materials. Revenues result from work performed on these contracts by our employees and our subcontractors and from costs for materials and other work-related costs allowed under our contracts. Revenues on cost-type contracts are recorded as contract allowable costs are incurred and fees are earned based on application of the right to invoice practical expedient in which revenue is recognized in direct proportion to our present right to consideration for progress towards the complete satisfaction of the performance obligation. Revenues on fixed-price contracts are recorded as work is performed over the period. Revenue is recognized over time using costs incurred to date, relative to total estimated costs at completion to measure progress toward satisfying our performance obligations. Revenues for time and materials contracts are recorded based on the amount we have the right to invoice our customers for work performed and materials delivered.
-5-
Customers
Our customers include various government clients and commercial entities. None of our customers comprise a significant amount of our 2019 consolidated revenues except our USPS work and FMS Program which was approximately 20% and 12%, respectively.
Revenues by Customer (dollars in thousands) Years ended December 31, | ||||||||||||||||||
Customer | 2019 | % | 2018 | % | 2017 | % | ||||||||||||
DoD | $ | 304,334 | 41 | $ | 334,494 | 48 | $ | 402,229 | 53 | |||||||||
Other government* | 205,775 | 27 | 212,118 | 30 | 218,426 | 29 | ||||||||||||
Commercial | 242,518 | 32 | 150,606 | 22 | 139,458 | 18 | ||||||||||||
Total | $ | 752,627 | 100 | $ | 697,218 | 100 | $ | 760,113 | 100 | |||||||||
*USPS is part of Other government
Backlog
Funded backlog represents a measure of potential future revenues from work performed on Federal Services Group government contracts. Funded backlog is defined as the appropriated and funded value of contracts, less the amount of revenues recognized on such contracts. Our reported backlog is comprised of funding received in incremental amounts for work that is generally expected to be completed within six to twelve months following the award of the funding. Our funded backlog for our Federal Services Group as of December 31, 2019, 2018 and 2017 was approximately $213 million, $290 million and $324 million, respectively. Changes in funded backlog on contracts are sometimes unpredictable due to uncertainties associated with changing government program priorities and availability of funds, which is heavily dependent upon the congressional authorization and appropriation process. Delays in this process may temporarily diminish the availability of funds for ongoing and planned work.
In addition to funded backlog levels, we have contract ceiling amounts available for use on multiple award, indefinite delivery, indefinite quantity contracts with DoD and federal civilian agencies. While these contracts increase the opportunities available for us to pursue future work, the actual amount of future work is indeterminate until task orders are placed on the contracts. Frequently, these task orders are competitively awarded. Additionally, these task orders must be funded by the procuring agencies before we can perform work and begin generating revenues.
Marketing
Our marketing activities are conducted by each of our businesses by industry specific sales representatives and professional marketing and business development staff. New customer contacts and information concerning new programs, requirements and opportunities become available through sales calls and client visits, negotiation with key business partners, and formal and informal briefings. We also participate in professional organizations, attend industry trade shows and events in the course of contract performance, and obtain literature published by government, trade associations, professional organizations and commercial entities.
Personnel
Our employees have a variety of specialized experience, training and skills that provide the expertise required to service our clients. As of December 31, 2019, we had 2,776 employees, compared to 2,228 as of December 31, 2018. Principal employee categories include (a) mechanics and vehicle, aircraft and equipment technicians, (b) logisticians, (c) warehouse and sales personnel, (d) engineers and technicians in mechanical, electronic, industrial, energy services, and (e) information technology professionals in computer systems, applications and products, configuration, change and data management disciplines. The expertise required by our customers frequently includes knowledge of government regulations and procedures. The amount of our unionized employees varies depending on the types of U.S. Government programs that we are supporting at any given time. As of December 31, 2019, approximately 35% of our total workforce was unionized, compared to 36% as of December 31, 2018.
We actively seek initiatives and participate in outreach programs to assist individuals who served in the U.S. Armed Forces. These efforts include an emphasis on hiring military veterans to enhance the quality of our workforce.
-6-
Government Regulation and Supervision
Our Federal Services Group business is affected by a variety of laws and regulations relating to the award, administration, and performance of U.S. Government contracts. See Risk Factors in Item 1A.
Our Federal Services Group operates in a heavily regulated environment and is routinely audited and reviewed by the U.S. Government and its agencies, including the Defense Contract Audit Agency ("DCAA"), and the Defense Contract Management Agency ("DCMA"). These agencies evaluate our contract performance, cost structures, and compliance with applicable laws, regulations, and standards, as well as review the adequacy of our business systems and processes relative to U.S. Government requirements. Business systems subject to audit or review include our accounting systems, purchasing systems, government property management systems, and estimating systems. If an audit uncovers improper or illegal activities, we may be subject to administrative, civil, or criminal proceedings, which could result in fines, penalties, repayments, or compensatory, treble, or other damages. Certain U.S. Government findings against a contractor can also lead to suspension or debarment from future U.S. Government contracts or the loss of export privileges. In addition, any costs we incur that are determined to be unallowable or improperly allocated to a specific contract will not be recovered or must be refunded if already reimbursed.
The U.S. Government has the ability, pursuant to regulations relating to contractor business systems, to decrease or partially withhold contract payments if it determines significant deficiencies exist in one or more such systems.
The U.S. Government generally has the ability to terminate contracts, in whole or in part, with little or no prior notice, for convenience or for default based on performance. In the event of termination of a contract for convenience, a contractor is customarily able to recover costs already incurred on the contract and receive profit on those costs up to the amount authorized under the contract, but not the anticipated profit that would have been earned had the contract been completed. Such a termination could also result in the cancellation of future work on the related program. Termination resulting from our default could expose us to various liabilities, including excess re-procurement costs, and could have a material effect on our ability to compete for future contracts.
Our business, our contracts with various agencies of the U.S. Government, and our subcontracts with other prime contractors are subject to a variety of laws and regulations, including, but not limited to, the Federal Acquisition Regulation ("FAR"), the Truth in Negotiations Act, the Procurement Integrity Act, the False Claims Act, U.S. Cost Accounting Standards ("CAS"), the International Traffic in Arms Regulations promulgated under the Arms Export Control Act, and the Foreign Corrupt Practices Act. A noncompliance determination by a government agency may result in reductions in contract values, contract modifications or terminations, penalties, fines, repayments, compensatory, treble, or other damages, or suspension or debarment.
Competition
The supply chain, logistics, distribution, and MRO services offered by our Aviation and Supply Chain Management groups and the federally contracted professional and technical services offered by our Federal Services Group are conducted in very competitive operating environments. The vehicle parts aftermarket and aviation parts and repair markets are fragmented, with many large and small global private and public competitors that compete for our customer base.
Large, diversified federal contracting firms with greater financial resources and larger technical staff are capable of providing the same services offered by us. Government agencies emphasize awarding contracts on a competitive basis as opposed to a sole source or other noncompetitive basis. Most of the significant contracts under which our Federal Services Group currently perform services were either initially awarded on a competitive basis or have been renewed at least once on a competitive basis. These contracts may be indefinite delivery/indefinite quantity type contracts for which the government makes awards for work among several other eligible contract holders, or they may be single award contracts with multiple option years that may or may not be exercised. Accordingly, there can be no assurance regarding the level of work we may obtain under some of these contracts. Government budgets, and in particular the budgets of certain government agencies, can also affect competition in our business. A reallocation of government spending priorities or reallocation of work for small business set-aside programs that results in lower levels of potential business in the markets we serve or the services we offer can cause increased competition.
The extent of competition that we will encounter as a result of changing economic or competitive conditions, customer requirements or technological developments is unpredictable. We believe the principal competitive factors for our business are customer knowledge, technical and financial qualifications, past performance, government budgetary priorities, sales force initiatives, and price.
-7-
Available Information
Copies of our publicly available Annual Reports on Form 10-K, Quarterly Reports on Form 10-Q, Current Reports on Form 8-K and amendments to those reports are filed with or otherwise furnished to the SEC pursuant to Section 13(a) or 15(d) of the Securities Exchange Act of 1934, as amended. Such reports and amendments are also available to the public free of charge through our website www.vsecorp.com as soon as reasonably practicable after the reports are electronically filed with the SEC. The SEC maintains an Internet site (http://www.sec.gov) that contains reports, proxy and information statements and other information regarding issuers that file electronically with the SEC.
-8-
ITEM 1A. Risk Factors
Our future results may differ materially from past results and from those projected in the forward-looking statements contained in this Form 10-K due to various uncertainties and risks, including those risks set forth below, nonrecurring events and other important factors disclosed previously and from time to time in our other reports filed with the SEC.
Uncertain government budgets and shifting government priorities could delay contract awards and funding and adversely affect our ability to continue work under our government contracts. Additionally, federal procurement directives could result in our loss of work on current programs to small business set-asides and large multiple award contracts.
Our government business is subject to funding delays, terminations (including at the government's convenience), reductions, in-sourcing, extensions and moratoriums associated with the government’s budgeting and contracting process. The federal procurement environment is unpredictable and could adversely affect our ability to perform work under new and existing contracts. We have experienced delays in contract awards and funding on our contracts in recent years that have adversely affected our ability to continue existing work and to replace expiring work. Additionally, our government business is subject to the risk that one or more of our potential contracts or contract extensions may be diverted by the contracting agency to a small or disadvantaged or minority-owned business pursuant to set-aside programs administered by the U.S. Small Business Administration, or may be bundled into large multiple award contracts for very large businesses. These risks can potentially have an adverse effect on our revenue growth and profit margins.
Intense competition from existing and new competitors may harm our business.
The aviation and vehicle parts industries are highly fragmented, have several highly visible leading companies, and are characterized by intense competition. Some of our OEM competitors have greater name recognition than VSE or our subsidiaries, as well as complementary lines of business and financial, marketing and other resources that we do not have. In addition, OEMs, aircraft maintenance providers, leasing companies and FAA-certificated repair facilities may attempt to bundle their services and product offerings in the supply industry, thereby significantly increasing industry competition.
Pressure on government budgets may adversely affect the flow of work to federal contractors, particularly new programs. Competitor contractors that experience a loss of government work have tended to redirect their marketing efforts toward the types of work that we perform. This increase in competition for our service offerings may adversely affect our ability to win new work or successor contracts to continue work that is currently performed by us under expiring contracts. Unsuccessful bidders frequently protest contract awards, which can delay or reverse the contract awards. Additionally, the government has frequently used contract award criteria that emphasizes lowest price, technically acceptable bids, which further intensifies competition in our government markets.
Certain programs comprise a material portion of our revenue. Our work on large government programs presents a risk to revenue growth and sustainability and profit margins.
The eventual expiration of large government programs or the loss of or disruption of revenues on a single contract may reduce our revenues and profits. Such revenue losses could also erode profits on our remaining programs that would have to absorb a larger portion of the fixed corporate costs previously allocated to the expiring programs or discontinued contract work. Our USPS managed inventory program and our FMS Program each constitute a material portion of our revenues and profits. This concentration of our revenue subjects us to the risk of material adverse revenue disruptions if customer operational decisions, government contractual or other issues prevent or delay the fulfillment of work requirements associated with these key programs. In recent years, revenue levels for our FMS Program have fluctuated widely enough to cause material changes in our overall revenue levels and affect our profit margins. Similarly, variations in volume and types of parts purchased by the USPS in recent years have caused changes in our profit margins.
The USPS has initiated a fleet replacement program for a next generation of the delivery vehicle fleet. The timing of both the roll out of a new fleet and the retirement of the current vehicles and their decision on how many of such vehicles will remain in the fleet could potentially have a significant impact on our future revenues and profits.
Changes to DoD business practices could have a material effect on DoD's procurement process and adversely impact our current programs and potential new awards.
The defense industry has experienced, and we expect will continue to experience, significant changes to business practices resulting from greater DoD focus on affordability, efficiencies, business systems, recovery of costs, and a reprioritization of
-9-
available defense funds to key areas for future defense spending. The DoD continues to adjust its procurement practices, requirements criteria, and source selection methodology in an ongoing effort to reduce costs, gain efficiencies, and enhance program management and control. We expect the DoD's focus on business practices to impact the contracting environment in which we operate as we and others in the industry adjust our practices to address the DoD's initiatives and the reduced level of spending by the DoD. Depending on how these initiatives are implemented, they could have an impact on our current programs, as well as new business opportunities with the DoD. As a result of certain of these initiatives, we experienced, and may continue to experience, a higher number of audits and/or lengthened periods of time required to close open audits. Such additional or lengthier audits could have a material adverse effect on our business, financial condition and results of operations.
Our success is highly dependent on the performance of the aviation aftermarket, which could be impacted by lower demand for business aviation and commercial air travel or airline fleet changes causing lower demand for our goods and services.
General global industry and economic conditions that affect the aviation industry may also affect our business. We are subject to macroeconomic cycles, and when recessions occur, we may experience reduced orders, payment delays, supply chain disruptions or other factors as a result of the economic challenges faced by our customers, prospective customers and suppliers. Further, the aviation industry has historically, from time to time, been subject to downward cycles which reduce the overall demand for jet engine and aircraft component replacement parts and repair and overhaul services, and such downward cycles result in lower sales and greater credit risk. Demand for commercial air travel can be influenced by airline industry profitability, world trade policies, government-to-government relations, terrorism, disease outbreaks, environmental constraints imposed upon aircraft operations, technological changes, price and other competitive factors. For example, the recent outbreak of COVID-19 coronavirus in Wuhan, China and other parts of the world, has resulted in travel disruption which could have an impact on airline spending and demand, if conditions worsen or extend for a prolonged period of time. China has also limited the shipment of products through its borders which could negatively impact our ability to receive certain products flowing through that region. At this point, the extent to which the coronavirus may impact our results is uncertain. These global industry and economic conditions may have a material adverse effect on our business, financial condition and results of operations.
Acquisitions, which have been a part of our business strategy in recent years, present certain risks.
A key element of our business strategy is growth through the acquisition of additional companies. VSE is focused on acquiring complementary assets that add new products, new customers, and new capabilities or new geographic and/or operational competitive advantages in both new and existing markets within our core competencies. Our acquisition strategy is affected by, and poses a number of challenges and risks, including availability of suitable acquisition candidates, availability of capital, diversion of management’s attention, effective integration of the operations and personnel of acquired companies, potential write downs of acquired intangible assets, potential loss of key employees of acquired companies, use of a significant portion of our available cash, compliance with debt covenants and consummation of acquisitions on satisfactory terms.
We may not be able to successfully execute our acquisition strategy, and the failure to do so could have a material adverse effect on our business, financial condition and results of operations.
Changes in future business conditions could cause business investments, recorded goodwill, and/or purchased intangible assets to become impaired, resulting in substantial losses and write-downs that would reduce our operating income.
As part of our business strategy, we acquire non-controlling and controlling interests in businesses. We make acquisitions and investments following careful analysis and due diligence processes designed to achieve a desired return or strategic objective. Business acquisitions involve estimates, assumptions, and judgments to determine acquisition prices, which are allocated among acquired assets, including goodwill, based upon fair market values. Notwithstanding our analyses, due diligence processes, and business integration efforts, actual operating results of acquired businesses may vary significantly from initial estimates. In such events, we may be required to write down our carrying value of the related goodwill and/or purchased intangible assets. In addition, declines in the trading price of our common stock or the market as a whole can result in goodwill and/or purchased intangible asset impairment charges associated with our existing businesses.
As of December 31, 2019, goodwill and purchased intangible assets generated from prior business acquisitions accounted for approximately 33% and 16%, respectively, of our total assets. We evaluate goodwill values for impairment annually in the fourth quarter or when evidence of potential impairment exists. We also evaluate the values of purchased intangible assets when evidence of potential impairment exists. The impairment tests are based on several factors requiring judgments. As a general matter, a significant decrease in expected cash flows or changes in market conditions may indicate potential impairment of recorded goodwill or purchased intangible assets.
-10-
Adverse equity market conditions that result in a decline in market multiples and the trading price of our common stock, or other events, such as reductions in future contract awards or significant adverse changes in our operating margins or the operating results of acquired businesses that vary significantly from projected results on which purchase prices are based, could result in an impairment of goodwill or other intangible assets. Any such impairments that result in us recording additional goodwill or intangible asset impairment charges could have a material adverse effect on our financial position or results of operations.
Our business could be adversely affected by government audits or investigations.
Government agencies, including the Defense Contract Audit Agency, the Defense Contract Management Agency and the Department of Labor, routinely audit and investigate government contractors. These agencies review a contractor’s performance under its contracts, cost structure and compliance with applicable laws, regulations and standards. The government also may review the adequacy of, and a contractor’s compliance with, its internal control systems and policies, including the contractor’s purchasing, property, estimating, compensation and management information systems. Any costs found to be improperly allocated to a specific contract will not be reimbursed and any such costs already reimbursed must be refunded.
The scope and rigor of government agency audits and investigations have increased in recent years, resulting in a greater likelihood that an audit or investigation may result in an adverse outcome. We have been subject to unfavorable findings and recommendations from various government agencies from time to time. We expect that government agencies will continue to rigorously audit and investigate us and there may be adverse or disputed findings, resulting in corrective action plans and/or settlements.
If an audit or investigation uncovers improper or illegal activities, we may be subject to civil and criminal penalties and administrative sanctions, including termination of contracts, forfeiture of profits, suspension of payments, fines and suspension or debarment from doing business with the government. In addition, we could suffer serious harm to our reputation if allegations of impropriety were made. Performance of international work can expose us to risks associated with the Foreign Corrupt Practices Act and Export Control Act compliance.
We are subject to numerous government rules and regulations that could expose us to potential liabilities or work loss.
We must comply with and are affected by laws and regulations relating to the award, administration and performance of government contracts. A violation of laws or regulations could result in the imposition of fines and penalties or the termination of contracts or debarment from working or bidding on government contracts.
In some instances, these government contract laws and regulations impose terms or rights that are significantly more favorable to the government than those typically available to commercial parties in negotiated transactions. For example, the government may terminate any government contract or subcontract at its convenience, as well as for performance default.
A termination for default could expose us to liability and have a material adverse effect on our ability to compete for future contracts and orders. A termination for default could also impact our past performance and ability to obtain new or additional work. In addition, the government could terminate a prime contract under which we are a subcontractor, irrespective of the quality of services provided by us as a subcontractor.
Additionally, our contract work that is performed by our subcontractors is subject to government compliance, performance requirements and financial risks. If any of our subcontractors fail to timely meet their contractual obligations or have regulatory compliance or other problems, our ability to fulfill our obligations as a prime contractor may be jeopardized.
The aviation industry is highly regulated by the U.S. Federal Aviation Administration ("FAA") and similar regulatory agencies in other countries. Aviation engines, engine accessories and components that we sell must meet certain airworthiness standards established by the FAA or the equivalent agencies in certain other countries. We also operate repair facilities that are licensed by the FAA and equivalent agencies of certain other countries to perform such services. New and more stringent regulations may be adopted in the future that could have an adverse effect on us.
Lastly, border tariffs and new trade deals could have significant effects on our customers and, in turn, on our suppliers, which may impact our business.
Global economic conditions and political factors could adversely affect our revenues.
Revenues for which work is performed in or products are delivered to foreign countries are subject to economic conditions in these countries and to political risks posed by ongoing foreign conflicts and potential terrorist activity. Significant domestic and
-11-
political unrest in client countries can constrain our ability to maintain consistent staffing levels, resulting in a fluctuating level of services performed by our employees. We cannot predict when these conditions will occur or the effect it will have on our revenues. Regime changes in these countries can result in government restrictions upon the continuation of ongoing work. Economic conditions in both the United States and foreign countries, and global prices and availability of oil and other commodities could potentially have an adverse effect on the demand for some of our services, including our aviation services.
Due to the nature of our work, we could potentially be exposed to legal actions arising from our operations.
Our work includes many manual tasks, including warehousing, shipping and packing of truck parts inventory, maintaining and repairing military and non-military vehicles, aircraft and equipment, and maintaining and overhauling U.S. Navy ships. Some of our work efforts involve the handling of hazardous materials. These services may pose certain challenges that could cause us to be exposed to legal and other liabilities arising from performance issues, work related incidents or employee misconduct that result in damages, injury or death to third parties. Such events could cause us to suffer financial losses and adversely affect our financial condition. See Item 3. "Legal Proceedings” below.
Technology security and cyber-attack risks could potentially impact our financial results.
We face the threat to our computer systems of unauthorized access, computer hackers, computer viruses, malicious code, organized cyber-attacks and other security problems and system disruptions, including possible unauthorized access to our and our clients' proprietary or classified information.
Some of our contract work includes data management and technology services associated with Social Security Administration and military medical and health records. This exposes us to certain information and technology security risks. If there is a security breach of sensitive data in our custody or for which we provide services, we could possibly be held liable for damages to third parties related to such security breach and incur costs to prevent future incidents. We also provide refurbishment, maintenance and training services support to international clients directly and through the DoD. Foreign nations with interests that conflict with the international clients we support could be motivated to conduct a cyber-attack to access information on these programs.
We maintain a cybersecurity risk management program to monitor and mitigate cybersecurity threats and an incident response plan for emerging threats. Costs associated with preventing or remediating information management security breaches or complying with related laws and regulations have not had a material adverse effect on our capital expenditures, earnings or competitive position. Additionally, we have obtained insurance that provides coverage for certain cybersecurity incidents. However, the occurrence of a future security breach event could potentially have such an adverse effect.
The nature of our operations and work performed by our employees present certain challenges related to work force management.
Our financial performance is heavily dependent on the abilities of our operating and administrative staff with respect to technical skills, operating performance, pricing, cost management, safety, and administrative and compliance efforts. A wide diversity of contract types, nature of work, work locations, and legal and regulatory complexities challenges our administrative staff and skill sets. We also face challenges associated with our quality of workforce, quality of work, safety, and labor relations compliance. Our current and projected work in foreign countries exposes us to challenges associated with export and ethics compliance, local laws and customs, workforce issues, extended supply chain, political unrest and war zone threats. Failure to attract or retain an adequately skilled workforce, lack of knowledge or training in critical functions, or inadequate staffing levels can result in lost work, reduced profit margins, losses from cost overruns, performance deficiencies, workplace accidents, and regulatory noncompliance.
Our business could be adversely affected by incidents that could cause an interruption in our operations or impose a significant financial liability on us.
Disruption of our operations due to internal or external system or service failures, accidents or incidents involving employees or third parties working in high-risk locations, or natural disasters, health crisis, epidemics or pandemics, including the recent outbreak of the COVID-19 coronavirus, or other crises could adversely affect our financial performance and condition. The recent outbreak of the coronavirus could impact our global supply chain network for any of our segments. A fire, flood, earthquake, or other natural disaster, health crises, epidemic, pandemic or other crisis at or affecting physical facilities that support key revenue generating operations, or a procurement system or contractual delay could potentially interrupt the revenues from our operations.
-12-
Investments in inventory and facilities could cause losses if certain work is disrupted or discontinued.
We have made investments in inventory, facilities and lease commitments to support specific business programs, work requirements, and service offerings. A slowing or disruption of these business programs, work requirements, or service offerings that results in operating below intended levels could cause us to suffer financial losses.
We are dependent on access to and the performance of third‑party package delivery companies.
Our ability to provide efficient distribution of the products we sell to our customers is an integral component of our overall business strategy, both domestic and international. We do not maintain our own delivery networks, and instead rely on third‑party package delivery companies. We cannot assure that we will always be able to ensure access to preferred shipping and delivery companies or that these companies will continue to meet our needs or provide reasonable pricing terms. In addition, if the package delivery companies on which we rely on experience delays resulting from inclement weather or other disruptions, we may be unable to maintain products in inventory and deliver products to our customers on a timely basis, which may adversely affect our results of operations and financial condition.
There can be no assurance we will continue to increase our dividends at current levels or in the future.
The payment of cash dividends and repurchases of our common stock are subject to limitations under applicable law and the discretion of our board of directors, considered in the context of then current conditions, including our earnings, other operating results, and capital requirements. Declines in asset values or increases in liabilities, including liabilities associated with benefit plans and assets and liabilities associated with taxes, can reduce stockholders’ equity. A deficit in stockholders’ equity could limit our ability under Delaware law to pay dividends.
Our debt exposes us to certain risks.
As of December 31, 2019, we had $270 million of total debt outstanding (net of unamortized debt issuance costs). The amount of our existing debt, combined with our ability to incur significant amounts of debt in the future, could have important consequences, including:
• | Increasing our vulnerability to adverse economic or industry conditions; |
• | Requiring us to dedicate a portion of our cash flow from operations to payments on our debt, thereby reducing the availability of our cash flow to fund working capital, capital expenditures, strategic initiatives, and general corporate purposes; |
• | Increasing our vulnerability to, and limiting our flexibility in planning for, or reacting to, changes in our business or the industries in which we operate; |
• | Exposing us to the risk of higher interest rates on borrowings under our Credit Facility, which are subject to variable rates of interest; |
• | Placing us at a competitive disadvantage compared to our competitors that have less debt; and |
• | Limiting our ability to borrow additional funds. |
In addition, the interest rate on our term loan borrowings and revolving loan borrowings is based on the London Interbank Offered Rate (“LIBOR”). LIBOR is the subject of recent national, international, and other regulatory guidance and proposals for reform. In July 2017, the Chief Executive of the U.K. Financial Conduct Authority (the “FCA”), which regulates LIBOR, announced that the FCA will no longer persuade or compel banks to submit rates for the calculation of the LIBOR benchmark after 2021. This announcement indicates that the continuation of LIBOR on the current basis cannot and will not be guaranteed after 2021, and it appears likely that LIBOR will be discontinued or modified by 2021. The consequences of the discontinuance of the LIBOR benchmark cannot be entirely predicted but could include an increase in the cost of our variable rate indebtedness.
Market volatility and adverse capital market conditions may affect our ability to access cost-effective sources of funding and may expose us to risks associated with the financial viability of suppliers and subcontractors.
The financial markets can experience high levels of volatility and disruption, reducing the availability of credit for certain issuers. We may access these markets from time to time to support certain business activities, including funding acquisitions and refinancing existing indebtedness. We may also access these markets to acquire credit support for our letters of credit. A number of factors could cause us to incur higher borrowing costs and experience greater difficulty accessing public and private markets for debt. These factors include disruptions or declines in the global capital markets and/or a decline in our financial performance,
-13-
outlook, or credit ratings. The occurrence of any or all of these events may adversely affect our ability to fund our operations, meet contractual commitments, make future investments or desirable acquisitions, or respond to competitive challenges.
Environmental and pollution risks could potentially impact our financial results.
Our operations are subject to and affected by a variety of existing federal, state, and local environmental protection laws and regulations. In addition, we could be affected by future laws or regulations, including those imposed in response to concerns over climate change, other aspects of the environment, or natural resources. We expect to incur future capital and operating costs to comply with current and future environmental laws and regulations, and such costs could be substantial, depending on the future proliferation of environmental rules and regulations and the extent to which we discover currently unknown environmental conditions.
Some of our contract work includes the use of chemical solvents and the handling of hazardous materials to maintain, repair, and refurbish vehicles, aircraft engines, and equipment. This exposes us to certain environmental and pollution risks. Various federal, state, and local environmental laws and regulations impose restrictions on the discharge of pollutants into the environment and establish standards for the transportation, storage, and disposal of toxic and hazardous wastes. Substantial fines, penalties, and criminal sanctions may be imposed for noncompliance, and certain environmental laws impose joint and several "strict liability" for remediation of spills and releases of oil and hazardous substances. Such laws and regulations impose liability upon a party for environmental cleanup and remediation costs and damage without regard to negligence or fault on the part of such party and could expose us to liability for the conduct of or conditions caused by third parties.
Costs associated with compliance with Federal, State and local provisions regulating the discharge of materials or that otherwise relate to the protection of the environment have not had a material adverse effect on our capital expenditures, earnings, or competitive position. However, we cannot predict the likelihood of such a material adverse effect should we experience the occurrence of a future environmental or pollution event.
The adoption of new environmental laws and regulations, stricter enforcement of existing laws and regulations, imposition of new cleanup requirements, discovery of previously unknown or more extensive contamination, litigation involving environmental impacts, our inability to recover related costs under our government contracts, or the financial insolvency of other responsible parties could cause us to incur costs that could have a material adverse effect on our financial position, results of operations, or cash flows.
ITEM 1B. Unresolved Staff Comments
None.
ITEM 2. Properties
Our executive and administrative headquarters are located in a five-story building in Alexandria, Virginia, with approximately 95,000 square feet of office space leased by us through April 2027.
We own facilities located in an industrial park in Somerset, Pennsylvania where we conduct our Supply Chain Management Group operations. These properties consist of approximately 30 acres of land and buildings totaling approximately 271,000 square feet of office, engineering and warehouse space.
We own three properties that we use to conduct our Aviation Group operations. One property consists of approximately one acre of land and a building with approximately 14,000 square feet of warehouse and office space in Miami, Florida. The second property consists of a building with approximately 30,500 square feet of warehouse and office space in Independence, Kansas that is located on leased municipal airport land. The third property consists of approximately nine acres of land and a building with approximately 60,000 square feet of warehouse and office space in Hebron, Kentucky, acquired in 2019.
We own and operate two facilities in Ladysmith, Virginia. One of these properties consists of approximately 44 acres of land and multiple storage and vehicle maintenance buildings totaling approximately 56,000 square feet of space. The other property consists of 30 acres of land and buildings totaling approximately 13,500 square feet of space. We also own and operate two properties in Texarkana, Arkansas consisting of an aggregate of approximately 16 acres of land and buildings totaling approximately 116,000 square feet. We use these properties primarily to provide refurbishment services for military equipment, storage and maintenance.
-14-
We also provide services and products from facilities generally occupied under short-term leases primarily located near customer sites to facilitate communications and enhance program performance. As of December 31, 2019, we leased approximately 19 such facilities with a total of approximately 349,000 square feet of office, shop and warehouse space. Our employees often provide services at customer facilities, limiting our requirement for additional space. We also provide services from locations outside of the United States, generally at foreign shipyards, U.S. military installations and aircraft parts distribution facilities.
ITEM 3. Legal Proceedings
As previously reported, on or about April 19, 2018 Joseph Waggoner, on behalf of himself and all similarly situated individuals, filed a lawsuit against VSE and two VSE subcontractors in the United States District Court, Eastern District of Texas, Texarkana Division, alleging overtime compensation entitlement at a rate of one and one-half times their regular rate of pay for all hours worked over 40 hours in a workweek. The plaintiffs worked under VSE’s contract with the United States Army at the Red River Army Depot in Texas. On January 14, 2020, the parties settled the lawsuit. While the settlement amount VSE agreed to pay the defendants was in excess of the amount that VSE had previously accrued as a loss provision in respect of the lawsuit, the difference is not material.
In addition to the above-referenced legal proceeding, we may have certain claims in the normal course of business, including legal proceedings against us and against other parties. In our opinion, the resolution of these other claims will not have a material adverse effect on our results of operations, financial position or cash flows. However, because the results of any legal proceedings cannot be predicted with certainty, the amount of loss, if any, cannot be reasonably estimated.
Further, from time-to-time, government agencies investigate whether our operations are being conducted in accordance with applicable contractual and regulatory requirements. Government investigations of us, whether relating to government contracts or conducted for other reasons, could result in administrative, civil or criminal liabilities, including repayments, fines or penalties being imposed upon us, or could lead to suspension or debarment from future government contracting. Government investigations often take years to complete and many result in no adverse action against us. We believe, based upon current information, that the outcome of any such government disputes and investigations will not have a material adverse effect on our results of operations, financial condition or cash flows.
ITEM 4. Mine Safety Disclosures
Not applicable.
-15-
PART II
ITEM 5. Market for Registrant's Common Equity, Related Stockholder Matters and Issuer Purchases of Equity Securities
VSE common stock, par value $0.05 per share, is traded on the NASDAQ, trading symbol, "VSEC," Newspaper listing, "VSE."
(a)Common Stock - Dividend Paid Per Share
Dividend Paid Per Share | ||||||||
Quarter Ended | 2019 | 2018 | ||||||
March 31 | $ | 0.08 | $ | 0.07 | ||||
June 30 | 0.09 | 0.08 | ||||||
September 30 | 0.09 | 0.08 | ||||||
December 31 | 0.09 | 0.08 | ||||||
For the Year | $ | 0.35 | $ | 0.31 | ||||
(b)Holders
As of February 1, 2020, VSE common stock, par value $0.05 per share, was held by approximately 229 stockholders of record. The number of stockholders of record is not representative of the number of beneficial holders because many of VSE's shares are held by depositories, brokers or nominees.
(c)Dividends
Pursuant to our bank loan agreement, as discussed in Note 8, Debt, of "Notes to Consolidated Financial Statements" in Item 8 of this Form 10-K, the payment of cash dividends is subject to annual restrictions. We have paid cash dividends each year since 1973 and have increased our dividend each year since 2004.
(d)Certain Sales and Repurchases of VSE Common Stock
During the fiscal year covered by this Form 10-K, VSE did not sell any of its equity securities that were not registered under the Securities Act of 1933, as amended. During the fourth quarter of the fiscal year covered by this Form 10-K, no purchases of equity securities of VSE were made by or on behalf of VSE or any "affiliated purchaser" (as defined in Rule 10b-18 (a)(3) under the Securities Exchange Act of 1934, as amended) other than 28,503 shares of our restricted common stock that were voluntarily forfeited to VSE by participants in its 2006 Restricted Stock Plan to cover their personal tax liability for restricted stock awards under the VSE Corporation 2006 Restricted Stock Plan (the "2006 Restricted Stock Plan").
-16-
(e) Equity Compensation Plan Information
We have two compensation plans approved by our stockholders under which our equity securities are authorized for issuance to employees and directors: (i) the VSE Corporation 2004 Non-Employee Directors Stock Plan and (ii) the 2006 Restricted Stock Plan.
As of December 31, 2019, 127,427 shares of VSE common stock were available for future issuance under the VSE Corporation 2004 Non-Employee Directors Stock Plan and 310,086 shares of VSE common stock were available for future issuance under the 2006 Restricted Stock Plan.
-17-
Performance Graph
Set forth below is a line graph comparing the cumulative total return of VSE common stock with (a) a performance index for the broad market, the NASDAQ Global Select Market, on which VSE common stock is traded, (b) a published industry index (our industry group is engineering and technical services (formerly SIC Code 8711)) that we have used historically (the "previous" peer group) and (c) a self-constructed peer group that we intend to use going forward (the "current" peer group). The current peer group is comprised of other public companies that operate in industries or lines of businesses similar to ours. These companies include Heico Corporation, Dorman Products, Inc., Navistar International Corporation, Vectrus, Inc., ManTech International Corporation, and CACI International Inc. The change in the peer groups was made as we believe the current peer group companies are representative examples of similarly situated competitors based on our operating segments.
The companies in the Peer Group have been weighted based on their relative market capitalization each year. The graph assumes that $100 was invested in our then outstanding common stock, the NASDAQ and the Peer Group index at the beginning of the five-year period and that all dividends were reinvested. The comparisons are not intended to be indicative of future performance of our common stock.
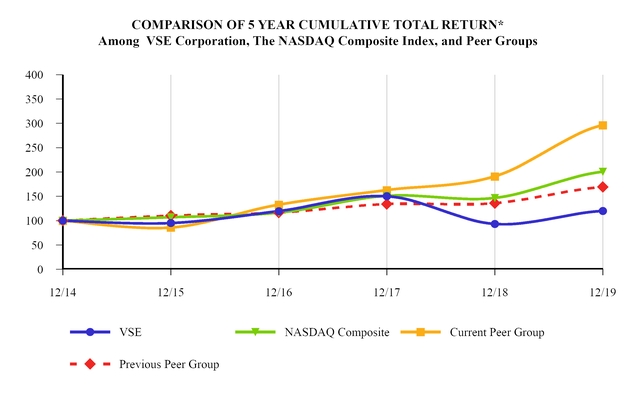
*$100 invested on 12/31/14 in stock or index, including reinvestment of dividends.
Fiscal year ending December 31.
Performance Graph Table
2014 | 2015 | 2016 | 2017 | 2018 | 2019 | ||||||
VSE | 100 | 95.01 | 119.55 | 149.98 | 93.28 | 119.94 | |||||
NASDAQ Composite | 100 | 106.96 | 116.45 | 150.96 | 146.67 | 200.49 | |||||
Current Peer Group | 100 | 85.74 | 132.66 | 162.72 | 190.89 | 296.10 | |||||
Previous Peer Group | 100 | 110.39 | 116.61 | 134.13 | 135.94 | 169.43 | |||||
-18-
ITEM 6. Selected Financial Data
This consolidated summary of selected financial data should be read in conjunction with Management's Discussion and Analysis of Financial Condition and Results of Operations included in Item 7 of this Form 10-K and with the Consolidated Financial Statements and related Notes included in Item 8 of this Form 10-K. Results for reporting periods beginning after January 1, 2018 are presented under the adoption of Accounting Standards Update ("ASU") 2014-09, Revenue from Contracts with Customers (Topic 606), while prior period amounts are not adjusted and continue to be reported in accordance with previous guidance. Effective January 1, 2019, we adopted ASU 2016-02, Leases (Topic 842), prior periods were not restated for the adoption of ASU 2016-02. The historical results set forth in this Item 6 are not necessarily indicative of VSE's future results of operations.
(in thousands, except per share data)
Years ended December 31, | |||||||||||||||||||
2019 | 2018 | 2017 | 2016 | 2015 | |||||||||||||||
Revenues | $ | 752,627 | $ | 697,218 | $ | 760,113 | $ | 691,790 | $ | 533,982 | |||||||||
Net income (1) | $ | 37,024 | $ | 35,080 | $ | 39,096 | $ | 26,793 | $ | 24,918 | |||||||||
Basic earnings per share: | |||||||||||||||||||
Net income (1) | $ | 3.38 | $ | 3.23 | $ | 3.61 | $ | 2.48 | $ | 2.32 | |||||||||
Diluted earnings per share: | |||||||||||||||||||
Net income (1) | $ | 3.35 | $ | 3.21 | $ | 3.60 | $ | 2.47 | $ | 2.31 | |||||||||
Cash dividends per common share | $ | 0.35 | $ | 0.31 | $ | 0.27 | $ | 0.235 | $ | 0.215 | |||||||||
(1) 2019, 2018 and 2017 Net income and basic and diluted earnings per share were impacted by the Tax Cuts and Jobs Act. See Note 11 "Income Taxes" to our Consolidated Financial Statements included below in Item 8.
As of December 31, | |||||||||||||||||||
2019 | 2018 | 2017 | 2016 | 2015 | |||||||||||||||
Working capital | $ | 191,158 | $ | 176,342 | $ | 134,563 | $ | 110,021 | $ | 100,780 | |||||||||
Total assets | $ | 845,864 | $ | 638,828 | $ | 629,013 | $ | 661,839 | $ | 617,354 | |||||||||
Long-term debt | $ | 253,128 | $ | 151,133 | $ | 165,614 | $ | 193,621 | $ | 215,243 | |||||||||
Long-term lease obligations | $ | 24,441 | $ | 18,913 | $ | 20,581 | $ | 21,959 | $ | 23,251 | |||||||||
Stockholders' equity | $ | 363,101 | $ | 328,395 | $ | 293,095 | $ | 255,194 | $ | 229,309 | |||||||||
-19-
ITEM 7. Management’s Discussion and Analysis of Financial Condition and Results of Operations
General Overview
Our Business
We are an aftermarket products and services company providing repair services, distribution, logistics, supply chain management and consulting services for land, sea and air transportation assets in the public and private sectors. We provide logistics and distribution services for legacy systems and equipment and professional and technical services to the government, including the DoD, federal civilian agencies, and to commercial and other customers. Our operations include supply chain management solutions, parts supply and distribution, and MRO services for vehicle fleet, aviation, and other customers. We also provide vehicle and equipment maintenance and refurbishment, logistics, engineering support, energy services, IT and health care IT solutions, and consulting services. See Item 1 “Business-Customers” above for revenues by customer.
The following discussion should be read along with our Consolidated Financial Statements included in Item 8 of this Annual Report on Form 10-K.
1st Choice Aerospace Acquisition
In January 2019, we acquired 1st Choice Aerospace, with operations in Florida and Kentucky. 1st Choice provides component MRO services and products for new generation and legacy commercial aircraft families. 1st Choice Aerospace is a subsidiary of VSE Aviation, Inc. under our Aviation Group. See Note (2) "Acquisition" to our Consolidated Financial Statements included below in Item 8 for additional information regarding our acquisition of 1st Choice Aerospace.
Organization and Segments
Our operations are conducted within three reportable segments aligned with our operating groups: (1) Aviation; (2) Supply Chain Management; and (3) Federal Services. We provide more information about each of these reportable segments under Item 1 “Business-History and Organization.”
Concentration of Revenues
(in thousands) Years ended December 31, | ||||||||||||||||||
Source of Revenues | 2019 | % | 2018 | % | 2017 | % | ||||||||||||
DoD | $ | 304,334 | 41 | $ | 334,494 | 48 | $ | 402,229 | 53 | |||||||||
Other government | 205,775 | 27 | 212,118 | 30 | 218,426 | 29 | ||||||||||||
Commercial | 242,518 | 32 | 150,606 | 22 | 139,458 | 18 | ||||||||||||
Total Revenues | $ | 752,627 | 100 | $ | 697,218 | 100 | $ | 760,113 | 100 | |||||||||
Business Trends
The following discussion provides a brief description of some of the key business factors impacting our results of operations detailed by segment.
Aviation Group
Organic revenue growth in our existing businesses was approximately 11%. Including contributions from the 1st Choice Aerospace acquisition, revenues increased approximately 54%. Growth in our distribution services was driven by our parts distribution expansion to global commercial and business and general aviation customers. Growth in our MRO services was driven by our acquisition of 1st Choice Aerospace. Since the acquisition, 1st Choice Aerospace's financial performance has exceeded our expectations on a revenue and operating income basis. We believe this progress, together with the introduction of new sales initiatives, have positioned us for further growth going forward. We have a positive outlook for the Aviation Group in 2020.
In the first quarter of 2020, we divested our Prime Turbines subsidiary, a business offering turboprop engine MRO services. We will no longer offer these services, focusing instead on higher growth component and accessory repair and parts distribution.
-20-
Supply Chain Management Group
Our Supply Chain Management Group continues to diversify beyond the USPS managed inventory program, with non-USPS group revenue growing nearly 20% on a year-over-year basis in 2019, supported by increased activity with commercial parts distribution. To enable this transition, we are focused on expanding its presence in both new and existing markets, including e-commerce solutions, private brand product sales, traditional parts supply, supply chain services, and just-in-time inventory programs. Our e-commerce fulfillment services showed promising growth in 2019 and we expect continued expansion of this service offering going forward. We have a positive outlook for the Supply Chain Group in 2020.
Federal Services Group
In the fourth quarter of 2019, we hired new leadership for our Federal Services Group as we prepare to navigate through a challenging year ahead for this group with a greater focus on growth and redefining VSE in the federal marketplace. We are investing in business development, growing our capability offerings, and broadening our range of new business targets to build our contract backlog and expand our markets. We expect positive results from these efforts over time and the revenue decline experienced in this business in 2019 may extend into 2020. This potential decline is primarily attributable to the completion of a large U. S. Army contract in January 2020. We expect our refocused business development efforts in 2020 to produce revenue growth in subsequent years.
Financial Statement Presentation
The following discussion provides a brief description of certain key items that appear in our consolidated financial statements:
Revenues
Revenues are derived from the delivery of products and from professional and technical services performed through various ordering agreements and contract agreements. The three primary types of contracts used are cost-type, fixed-price, and time and materials. Revenues from these contracts result from work performed on these contracts and from costs for materials and other work-related contract allowable costs.
Costs and Operating Expenses
Costs and operating expenses consist primarily of cost of inventory and delivery of our products sold; direct costs, including labor, material, and supplies used in the performance of our contract work; indirect costs associated with our direct contract costs; sales, general, and administrative expenses associated with our operating groups and corporate management; and certain costs and charges arising from nonrecurring events outside the ordinary course of business. These costs will generally increase or decrease in conjunction with our level of products sold or contract work performed. Costs and operating expenses also include expense for amortization of intangible assets acquired through our acquisitions. Expense for amortization of acquisition related intangible assets is included in the segment results in which the acquisition is included. Segment results also include expense for an allocation of corporate management costs.
Bookings and Funded Backlog
Revenues for government contract work performed by our Federal Services Group depend on contract funding (“bookings”), and bookings generally occur when contract funding documentation is received. Funded contract backlog is an indicator of potential future revenue. While bookings and funded contract backlog generally result in revenue, we may occasionally have funded contract backlog that expires or is de-obligated upon contract completion and does not generate revenue.
A summary of our bookings and revenues for our Federal Services Group for the years ended December 31, 2019, 2018 and 2017, and funded contract backlog for this group as of December 31, 2019, 2018 and 2017 is as follows (in millions):
2019 | 2018 | 2017 | |||||||||
Bookings | $ | 228 | $ | 321 | $ | 430 | |||||
Revenues | $ | 314 | $ | 337 | $ | 411 | |||||
Funded Backlog | $ | 213 | $ | 290 | $ | 324 | |||||
-21-
Critical Accounting Policies, Estimates and Judgments
Our consolidated financial statements are prepared in accordance with United States generally accepted accounting principles ("U.S. GAAP"), which require us to make estimates and assumptions. Certain critical accounting policies affect the more significant accounts, particularly those that involve judgments, estimates and assumptions used in the preparation of our consolidated financial statements. The development and selection of these critical accounting policies have been determined by our management. We have reviewed our critical accounting policies and estimates with the audit committee of our board of directors. Due to the significant judgment involved in selecting certain of the assumptions used in these policies, it is possible that different parties could choose different assumptions and reach different conclusions. We consider our policies relating to the following matters to be critical accounting policies.
Revenue Recognition
We account for revenue in accordance with ASC 606. The unit of account in ASC 606 is a performance obligation. At the inception of each contract with a customer, we determine our performance obligations under the contract and the contract's transaction price. A performance obligation is a promise in a contract to transfer a distinct good or service to the customer and is defined as the unit of account. A contract’s transaction price is allocated to each distinct performance obligation and recognized as revenue when the performance obligation is satisfied. The majority of our contracts have a single performance obligation as the promise to transfer the respective goods or services is not separately identifiable from other promises in the contracts and is, therefore, not distinct. For product sales, each product sold to a customer typically represents a distinct performance obligation. Our performance obligations are satisfied over time as work progresses or at a point in time based on transfer of control of products and services to our customers.
Contract modifications are routine in the performance of our contracts. Contracts are often modified to account for changes in contract specifications or requirements. In most instances, contract modifications are for goods or services that are not distinct, and therefore are accounted for as part of the existing contract.
Substantially all Supply Chain Management Group revenues from the sale of vehicle parts to customers are recognized at the point in time of the transfer of control to the customer. Sales returns and allowances for vehicle parts are not significant.
Our Aviation Group revenues result from the sale of aircraft parts and performance of MRO services for private and commercial aircraft owners, other aviation MRO providers, and aviation original equipment manufacturers. Our Aviation Group recognizes revenues for the sale of aircraft parts at a point in time when control is transferred to the customer, which usually occurs when the parts are shipped. Our Aviation Group recognizes revenues for MRO services over time as the services are transferred to the customer. MRO services revenue recognized is measured based on the cost-to-cost input method, as costs incurred reflect the work completed, and therefore the services transferred to date. Sales returns and allowances are not significant.
Our Federal Services Group revenues result from professional and technical services, which we perform for customers on a contract basis. Revenue is recognized for performance obligations over time as we transfer the services to the customer. The three primary types of contracts used are cost-type, fixed-price and time and materials. Revenues result from work performed on these contracts by our employees and our subcontractors and from costs for materials and other work-related costs allowed under our contracts.
Revenues on cost-type contracts are recorded as contract allowable costs are incurred and fees are earned. Variable consideration, typically in the form of award fees, is included in the estimated transaction price, to the extent that it is probable that a significant reversal will not occur, when there is a basis to reasonably estimate the amount of the fee. These estimates are based on historical award experience, anticipated performance and our best judgment based on current facts and circumstances.
Revenues on fixed-price contracts are recorded as work is performed over the period. Revenue is recognized over time using costs incurred to date relative to total estimated costs at completion to measure progress toward satisfying our performance obligations. Incurred cost represents work performed, which corresponds with the transfer of control to the customer. For such contracts, we estimate total costs at the inception of the contract based on our assumptions of the cost elements required to complete the associated tasks of the contract and assess the effects of the risks on our estimates of total costs to complete the contract. Our cost estimates are based on assumptions that include the complexity of the work, our employee labor costs, the cost of materials and the performance of our subcontractors. These cost estimates are subject to change as we perform under the contract and as a result, the timing of revenues and amount of profit on a contract may change as there are changes in estimated costs to complete the contract. Such adjustments are recognized on a cumulative catch-up basis in the period we identify the changes.
-22-
Revenues for time and materials contracts are recorded based on the amount for which we have the right to invoice our customers, because the amount directly reflects the value of our work performed for the customer. Revenues are recorded on the basis of contract allowable labor hours worked multiplied by the contract defined billing rates, plus the direct costs and indirect cost burdens associated with materials and subcontract work used in performance on the contract. Generally, profits on time and materials contracts result from the difference between the cost of services performed and the contract defined billing rates for these services.
Revenues related to work performed on government contracts at risk, which is work performed at the customer's request prior to the government formalizing funding, is not recognized until it can be reliably estimated and its realization is probable.
A substantial portion of contract and administrative costs are subject to audit by the Defense Contract Audit Agency. Our indirect cost rates have been audited and approved for 2013 and prior years with no material adjustments to our results of operations or financial position. While we maintain reserves to cover the risk of potential future audit adjustments based primarily on the results of prior audits, we do not believe any future audits will have a material adverse effect on our results of operations, financial position, or cash flows.
Business Combinations
We account for business combinations under the acquisition method of accounting. The purchase price of each business acquired is allocated to the tangible and intangible assets acquired and the liabilities assumed based on information regarding their respective fair values on the date of acquisition. Any excess of the purchase price over the fair value of the separately identifiable assets acquired and liabilities assumed is allocated to goodwill. Determining the fair value of assets acquired and liabilities assumed requires management's judgment and often involves the use of significant estimates and assumptions, including assumptions with respect to future cash inflows and outflows, discount rates, and market multiples, among other items. We determine the fair values of intangible assets acquired generally in consultation with third-party valuation advisors. The valuation of assets acquired and liabilities assumed requires a number of judgments and is subject to revision as additional information about the fair values becomes available. We will recognize any adjustments to provisional amounts that are identified during the period not to exceed twelve months from the acquisition date (the "measurement period") in which the adjustments are determined. Acquisition costs are expensed as incurred. The results of operations of businesses acquired are included in the consolidated financial statements from their dates of acquisition.
As part of the agreement to acquire certain subsidiaries, we may be obligated to pay contingent consideration should the acquired entity meet certain earnings objectives subsequent to the date of acquisition. As of the acquisition date, contingent consideration is recorded at fair value as determined through the use of a probability-based scenario analysis approach. Under this approach, a set of potential future subsidiary earnings is estimated based on various revenue growth rate assumptions for each scenario. A probability of likelihood is then assigned to each potential future earnings estimate and the resultant contingent consideration is calculated and discounted using a weighted average discount rate. The fair value is measured each reporting period subsequent to the acquisition date and any changes are recorded within cost and operating expenses within our consolidated statement of income. Changes in either the revenue growth rates, related earnings or the discount rate could result in a material change to the amount of the contingent consideration accrued.
Goodwill and Intangible Assets
Goodwill is subject to a review for impairment at least annually. We perform an annual review of goodwill for impairment during the fourth quarter and whenever events or other changes in circumstances indicate that the carrying value may not be fully recoverable. We estimate the fair value of our reporting units using a weighting of fair values derived from the income approach and market approach. Under the income approach, we calculate the fair value of a reporting unit based on the present value of estimated future cash flows. Cash flow projections are based on our estimates of revenue growth rates and operating margins, taking into consideration industry and market conditions. The discount rate used is based on a weighted average cost of capital adjusted for the relevant risk associated with the characteristics of the business and the projected cash flows.
In the fourth quarter of 2019, we performed our annual goodwill impairment analysis for each of our reporting units with goodwill. The results of the impairment analysis indicated that our reporting units had fair values substantially in excess of their carrying values except for our VSE Aviation reporting unit.
The fair value of our VSE Aviation reporting unit, within our Aviation Group, exceeded its carrying value by approximately 6%. While the revenue and operating income of our Aviation reporting unit improved since the prior year impairment test, the fair value of our Aviation reporting unit can be significantly impacted by changes in expected future orders, discount rates and long
-23-
term growth rates, along with other significant judgments. Recent operating performance, along with assumptions for specific customer and industry opportunities, were considered in the key assumptions used during the 2019 impairment analysis. The key valuation assumptions used in the analysis of this reporting unit are a discount rate of 13% and an average revenue growth rate of 10% over a seven-year period, and a long-term revenue growth rate of 3% in the terminal year. We determined this reporting unit may have an increased likelihood of impairment if a prolonged downturn in customer demand were to occur, or if the reporting unit was not able to execute against customer opportunities, and the long-term outlook of its cash flows were adversely impacted. Furthermore, the fair value of the reporting unit could be adversely affected by other market factors such as an increase in the discount rate used in the income approach or a decrease in the market multiples used in the market approach, or an increase in the carrying value of this reporting unit.
The carrying value of our VSE Aviation reporting unit included goodwill of approximately $182.4 million as of December 31, 2019, which includes $77.8 million of goodwill resulting from the acquisition of 1st Choice Aerospace.
As of December 31, 2019, we have no intangible assets with indefinite lives and we had an aggregate of approximately $276 million of goodwill associated with our acquisitions.
Income Taxes
Income taxes are accounted for under the asset and liability method. Under the asset and liability method, deferred tax assets and liabilities are recognized for the estimated future tax consequences attributable to differences between the financial statement carrying amounts of existing assets and liabilities and their respective tax basis. This method also requires the recognition of future tax benefits, such as net operating loss carryforwards, to the extent that realization of such benefits is more likely than not. Deferred tax assets and liabilities are measured using enacted tax rates expected to apply to taxable income in the years in which those temporary differences are expected to be recovered or settled. The effect on deferred tax assets and liabilities of a change in tax rates is recognized in income in the period that includes the enactment date.
The carrying value of net deferred tax assets is based on assumptions regarding our ability to generate sufficient future taxable income to utilize these deferred tax assets
Recently Issued Accounting Pronouncements
For a description of recently announced accounting standards, including the expected dates of adoption and estimated effects, if any, on our consolidated financial statements, see "Recently Issued Accounting Pronouncements" in Note 1 to our Consolidated Financial Statements included below in Item 8.
Results of Operations
The following discussion of our Results of Operations and Liquidity and Capital Resources includes a comparison of fiscal 2019 to fiscal 2018. For a similar discussion that compares fiscal 2018 to fiscal 2017, refer to Item 7, "Management's Discussion and Analysis of Financial Condition and Results of Operations," of our Form 10-K for the fiscal year ended December 31, 2018.
Consolidated Statements of Income (in thousands) Years ended December 31, | ||||||||||||||||||||
2019 | % | 2018 | % | 2017 | % | |||||||||||||||
Revenues | $ | 752,627 | 100.0 | $ | 697,218 | 100.0 | $ | 760,113 | 100.0 | |||||||||||
Costs and operating expenses | 692,370 | 92.0 | 644,688 | 92.4 | 705,788 | 92.9 | ||||||||||||||
Gain on sale of contract | — | — | 1,700 | 0.2 | — | — | ||||||||||||||
Operating income | 60,257 | 8.0 | 54,230 | 7.8 | 54,325 | 7.1 | ||||||||||||||
Interest expense, net | 13,830 | 1.8 | 8,982 | 1.3 | 9,240 | 1.2 | ||||||||||||||
Income before income taxes | 46,427 | 6.2 | 45,248 | 6.5 | 45,085 | 5.9 | ||||||||||||||
Provision for income taxes | 9,403 | 1.3 | 10,168 | 1.5 | 5,989 | 0.8 | ||||||||||||||
Net income | $ | 37,024 | 4.9 | $ | 35,080 | 5.0 | $ | 39,096 | 5.1 | |||||||||||
Year Ended 2019 Compared to Year ended 2018
-24-
Revenues
Our revenues increased by approximately $55 million or 8% for the year ended December 31, 2019 as compared to the prior year. The change in revenues for this period resulted from an increase in our Aviation Group revenues of approximately $79 million and a decrease in Federal Services Group revenues of approximately $23 million. Our Supply Chain Management Group revenues were substantially unchanged from the prior year. See "Segment Operating Results" for a breakdown of our results of operations by segment.
Costs and Operating Expenses
Our costs and operating expenses increased by approximately $48 million or 7% in 2019 as compared to 2018. The change in costs and operating expenses resulted primarily from an increase in our Aviation Group of approximately $72 million, an increase in our Supply Chain Management Group of approximately $0.5 million, and a decrease in our Federal Services Group of approximately $27 million. Costs and expenses for 2019 included approximately $2.3 million of acquisition related and executive succession costs.
Operating Income
Our operating income for 2019 increased approximately $6.0 million or 11.1% as compared to 2018. Operating income increased by approximately $6.8 million for our Aviation Group and approximately $2.3 million for our Federal Services Group and decreased by approximately $0.8 million for our Supply Chain Management Group. Operating income for 2019 was decreased by approximately $2.3 million due to the costs and expenses associated with acquisition related and executive succession costs.
Interest Expense
Interest expense increased approximately $4.8 million in 2019 as compared to 2018 primarily due to additional borrowing associated with the 1st Choice Aerospace acquisition in January 2019.
Provision for Income Taxes
Our effective tax rate was 20.3% for 2019, 22.5% for 2018, and 13.3% for 2017. The Tax Act passed in December 2017 resulted in a decrease to our federal tax rate and cash tax payments beginning 2018. Due to the Tax Act, we recorded a one-time reduction in our deferred tax liabilities in the fourth quarter of 2017 that resulted in a reduction in our provision for income taxes of approximately $10.6 million for the year and lowered our effective tax rate for 2017. The reduction in our effective tax rate in 2019 from 2018 was primarily attributable to: (1) unrealized investment gain from our COLI plan in the current year; (2) specific Tax Act related regulations issued by the Treasury in 2019 that resulted in favorable adjustment to our prior year estimates; and (3) some state job tax credits approved in 2019.
Our tax rate is also affected by discrete items that may occur in any given year but may not be consistent from year to year. In addition to state income taxes, certain tax credits and other items caused differences between our statutory U.S. Federal income tax rate and our effective tax rate. Other permanent differences and federal and state tax credits such as foreign derived intangible income ("FDII") deduction, the work opportunity tax credit, and educational improvement tax credits provide benefit to our tax rates.
Segment Operating Results
Aviation Group Results
The results of operations for our Aviation Group are (in thousands):
Years ended December 31, | |||||||||||||||||||
2019 | % | 2018 | % | 2017 | % | ||||||||||||||
Revenues | $ | 224,546 | 100.0 | 145,423 | 100.0 | 134,809 | 100.0 | ||||||||||||
Costs and operating expenses | 206,645 | 92.0 | 134,347 | 92.4 | 125,114 | 92.8 | |||||||||||||
Operating income | $ | 17,901 | 8.0 | $ | 11,076 | 7.6 | 9,695 | 7.2 | |||||||||||
-25-
Revenues for our Aviation Group increased approximately $79 million or 54% for 2019 as compared to the prior year. Distribution revenues increased approximately $30 million and repair revenues increased approximately $49 million. Costs and operating expenses increased approximately $72 million or 54% and operating income increased approximately $7 million or 62% for 2019, primarily due to the revenue increase. Our 2019 results include repair revenues, costs and expenses, and operating income from our January 2019 acquisition of 1st Choice Aerospace.
Costs and operating expenses for this group include expense for amortization of intangible assets associated with acquisitions, allocated corporate costs, and valuation adjustments to accrued earn-out obligations associated with acquisitions. Expense for amortization of intangible assets was approximately $10 million and $6.6 million for 2019 and 2018, respectively. Expense for allocated corporate costs was approximately $6.6 million and $4.2 million for 2019 and 2018, respectively. Valuation adjustments to the accrued earn-out obligation increased costs and operating expenses approximately $1.9 million for 2019.
Supply Chain Management Group Results
The results of operations for our Supply Chain Management Group are (in thousands):
Years ended December 31, | ||||||||||||||||||||
2019 | % | 2018 | % | 2017 | % | |||||||||||||||
Revenues | $ | 214,520 | 100.0 | $ | 214,809 | 100.0 | $ | 214,542 | 100.0 | |||||||||||
Costs and operating expenses | 184,701 | 86.1 | 184,183 | 85.7 | 180,788 | 84.3 | ||||||||||||||
Operating income | $ | 29,819 | 13.9 | $ | 30,626 | 14.3 | 33,754 | 15.7 | ||||||||||||
Revenues for our Supply Chain Management Group were substantially unchanged for 2019, as compared to the prior year. Revenues from sales to the DoD were substantially unchanged, revenues from sales to other government customers decreased approximately $8.1 million or 5%, and revenues from commercial customers increased approximately $7.8 million or 55%. Costs and operating expenses increased approximately $0.5 million or 0.3% and operating income decreased by approximately $0.8 million or 3% for 2019 as compared to the prior year. The decrease in operating income was primarily attributable to a change in the mix of customers and products sold, which lowered our profit margins.
Federal Services Group Results
The results of operations for our Federal Group are (in thousands):
Years ended December 31, | ||||||||||||||||||
2019 | % | 2018 | % | 2017 | % | |||||||||||||
Revenues | $ | 313,561 | 100.0 | 336,986 | 100.0 | 410,762 | 100.0 | |||||||||||
Costs and operating expenses | 295,417 | 94.2 | 322,889 | 95.8 | 397,343 | 96.7 | ||||||||||||
Gain on sale of contract | — | — | 1,700 | 0.5 | — | — | ||||||||||||
Operating income | $ | 18,144 | 5.8 | 15,797 | 4.7 | 13,419 | 3.3 | |||||||||||
Revenues for our Federal Services Group decreased approximately $23 million or 7% and costs and operating expenses decreased approximately $27 million or 9% for 2019, as compared to the prior year primarily due to the changes in the level of work required on our existing contracts. Significant items affecting changes in our revenues and costs and operating expenses for 2019 included a decrease of approximately $51 million in revenues from our FMS Program, an increase of approximately $23 million in revenues from our U. S. Army work, and increased revenues of approximately $5 million from other work.
Gain on sale of contract is comprised of $1.7 million associated with the sale of an indefinite-delivery/indefinite-quantity government-wide acquisition contract in the third quarter of 2018.
Operating income increased approximately $2.3 million or 15% for 2019 compared to the prior year. Revenue declines occurred in our lower margin work, resulting in minimal loss of operating income, and we have increased operating income through margin improvements on our other work.
-26-
Financial Condition
There has been no material adverse change in our financial condition in 2019. Our bank debt increased approximately $110 million primarily due to our acquisition of 1st Choice Aerospace in January 2019. Changes to asset and liability accounts were primarily due to our earnings, our level of business activity, the timing of inventory purchases, contract delivery schedules, subcontractor and vendor payments required to perform our contract work, the timing of associated billings to and collections from our customers, and the acquisition. In November 2019, we amended our bank loan agreement to increase the amount of bank loan commitments available to us from $373.3 million to $473.3 million and modify other terms and conditions.
Liquidity and Capital Resources
Cash Flows
Cash and cash equivalents increased by approximately $572 thousand during 2019.
Cash provided by operating activities decreased approximately $861 thousand in 2019 as compared to 2018. The change was attributable to an increase of approximately $1.9 million in cash provided by net income, an increase of approximately $6.4 million in other non-cash operating activities and a decrease of approximately $9.2 million due to changes in the levels of operating assets and liabilities.
Inventories and accounts receivable represent a significant amount of our assets, and accounts payable represent a significant amount of our operating liabilities. Cash used related to increases in inventory was approximately $44.2 million, cash used related to increases in receivables and unbilled receivables was approximately $7.9 million, and cash provided by increases in accounts payable and deferred compensation was approximately $7.7 million for 2019. A significant portion of accounts receivable and accounts payable result from the use of subcontractors to perform work on our contracts and from the purchase of materials and inventory to fulfill contract obligations and distribution agreements. Accordingly, our levels of accounts receivable and accounts payable may fluctuate depending on the timing of material and inventory purchases, services ordered, product sales, government funding delays, the timing of billings received from subcontractors and materials vendors, and the timing of payments received for services. Such timing differences have the potential to cause significant increases and decreases in our inventory, accounts receivable, and accounts payable in short time periods, and accordingly, can cause increases or decreases in our cash provided by operations.
Cash used in investing activities increased approximately $121.5 million in 2019 as compared to 2018. In 2019, approximately $113.0 million was used for the acquisition of 1st Choice Aerospace and approximately $5.0 million was used for the purchase of an operating facility for 1st Choice Aerospace. Other cash used in investing activities in 2019 and 2018 consisted primarily of purchases of property and equipment and the sale of a contract in 2018.
Cash provided by financing activities was approximately $105.4 million in 2019 as compared to cash used in financing activities of approximately $18.0 million in 2018. Financing activities consisted primarily of borrowing and repayment of debt, payment of dividends and debt financing costs.
We paid cash dividends totaling approximately $3.7 million or $0.34 per share during 2019. Pursuant to our bank loan agreement, our payment of cash dividends is subject to annual restrictions. We have paid cash dividends each year since 1973 and have increased our dividend each year since 2004.
Liquidity
Our internal sources of liquidity are primarily from operating activities, specifically from changes in our level of revenues and associated inventory, accounts receivable and accounts payable, and from profitability. Significant increases or decreases in revenues and inventory, accounts receivable and accounts payable can affect our liquidity. Our inventory and accounts payable levels can be affected by the timing of large opportunistic inventory purchases. Our accounts receivable and accounts payable levels can be affected by changes in the level of contract work we perform, by the timing of large materials purchases and subcontractor efforts used in our contracts, and by delays in the award of contractual coverage and funding and payments. Government funding delays can cause delays in our ability to invoice for revenues earned, presenting a potential negative impact on our days sales outstanding.
We also purchase property and equipment; invest in expansion, improvement, and maintenance of our operational and administrative facilities; and invest in the acquisition of other companies.
-27-
Our external financing consists of a loan agreement with a bank group that provides for a term loan, revolving loans and letters of credit. The loan agreement, which was amended in November 2019 and expires in January 2023, has a term loan facility and a revolving loan facility. The revolving loan facility provides for revolving loans and letters of credit.
The term loan requires quarterly installment payments. Our required term loan payments after December 31, 2019 are approximately $17.8 million in 2020, $21.6 million in 2021, $22.5 million in 2022, and $58.9 million in 2023. The amount of term loan borrowings outstanding as of December 31, 2019 was $120.8 million.
The maximum amount of credit available to us under the loan agreement for revolving loans and letters of credit as of December 31, 2019 was $350 million. We pay an unused commitment fee and fees on letters of credit that are issued. We had approximately $152.0 million in revolving loan amounts outstanding and $54 thousand of letters of credit outstanding as of December 31, 2019. We had approximately $81.9 million in revolving loan amounts outstanding and $57 thousand letters of credit outstanding as of December 31, 2018.
Under the loan agreement we may elect to increase the maximum availability of the term loan facility, the revolving loan facility, or a combination of both facilities. The aggregate limit of incremental increases is $100 million.
Total bank loan borrowed funds outstanding, including term loan borrowings and revolving loan borrowings, were approximately $272.8 million and $162.7 million as of December 31, 2019 and 2018, respectively. These amounts exclude unamortized deferred financing costs of approximately $2.8 million and $2.1 million as of December 31, 2019 and 2018, respectively. The fair value of outstanding debt under our bank loan facilities as of December 31, 2019 approximates its carrying value using Level 2 inputs based on market data on companies with a corporate rating similar to ours that have recently priced credit facilities.
We pay interest on the term loan borrowings and revolving loan borrowings at LIBOR plus a base margin or at a base rate (typically the prime rate) plus a base margin. As of December 31, 2019, the LIBOR base margin was 2.50% and the base rate base margin was 1.25%. The base margins increase or decrease in increments as our Total Funded Debt/EBITDA Ratio increases or decreases.
The loan agreement requires us to have interest rate hedges on a portion of the outstanding term loan until February 6, 2021. We executed compliant interest rate hedges. As of December 31, 2019, interest rates on portions of our outstanding debt ranged from 4.21% to 6.00%, and the effective interest rate on our aggregate outstanding debt was 4.77%.
Interest expense incurred on bank loan borrowings and interest rate hedges was approximately $13.3 million and $6.9 million during the years ended December 31, 2019 and 2018, respectively.
The loan agreement contains collateral requirements to secure our loan agreement obligations, restrictive covenants, a limit on annual dividends, and other affirmative and negative covenants, conditions and limitations. The restrictive covenants require that we maintain a Fixed Charge Coverage Ratio of not less than 1.20 to 1.00 and a Funded Debt/EBITDA Ratio of not more than 3.50 to 1.00 (subject to adjustment, in certain circumstances). We were in compliance with required ratios and other terms and conditions as of December 31, 2019.
We currently do not use public debt security financing.
Contractual Obligations
Our contractual obligations as of December 31, 2019 are (in thousands):
Payments Due by Period | ||||||||||||||||||||
Contractual Obligations | Total | Less than 1 year | 1-3 years | 4-5 years | After 5 years | |||||||||||||||
Bank loan debt | $ | 272,800 | $ | 17,800 | $ | 44,100 | $ | 210,900 | $ | — | ||||||||||
Operating lease obligations | 34,382 | 5,468 | 10,390 | 9,091 | 9,433 | |||||||||||||||
Purchase obligations | 130 | 56 | 74 | — | — | |||||||||||||||
Total | $ | 307,312 | $ | 23,324 | $ | 54,564 | $ | 219,991 | $ | 9,433 | ||||||||||
-28-
Estimated cash requirements for interest on our bank loan debt are approximately $13 million for 2020 and $11 million for 2021.
Inflation and Pricing
Most of our contracts provide for estimates of future labor costs to be escalated for any option periods, while the non-labor costs in our contracts are normally considered reimbursable at cost. Our property and equipment consist principally of land, buildings and improvements, shop and warehouse equipment, computer systems equipment, and furniture and fixtures. We do not expect the overall impact of inflation on replacement costs of our property and equipment to be material to our future results of operations or financial condition.
Off-Balance Sheet Arrangements
We do not have any off-balance sheet arrangements that have, or are reasonably likely to have, a current or future material effect on our financial condition, changes in financial condition, revenue or expenses, results of operations, liquidity, capital expenditures or capital resources.
ITEM 7A. Quantitative and Qualitative Disclosures About Market Risks
Interest Rates
Our bank loan agreement provides available borrowing to us at variable interest rates. Accordingly, future interest rate changes could potentially put us at risk for a material adverse impact on future earnings and cash flows. To mitigate the risks associated with future interest rate movements we have employed interest rate hedges to fix the rate on a portion of our outstanding borrowings for various periods. The resulting fixed rates on this portion of our debt give us protection against interest rate increases.
In February 2018, we entered into a LIBOR based interest rate swap on our term loan for a term of three years with a notional amount of $10 million for the first year and $50 million for the second and third years. We pay an effective interest rate of 2.54% plus our base margin on the debt matched to this swap. In February 2019, we entered into a LIBOR based interest rate swap on our revolving loan for a term of three years with a notional amount of $75 million. This swap amount decreases in increments on an annual basis to $45 million for the second year and to $25 million for the third year. We pay an effective interest rate of 2.805% plus our base margin on the debt matched to it.
-29-
ITEM 8. Financial Statements and Supplementary Data
Index to Consolidated Financial Statements | |
Page | |
-30-
Report of Independent Registered Public Accounting Firm
Board of Directors and Stockholders
VSE Corporation
Opinion on the financial statements
We have audited the accompanying consolidated balance sheet of VSE Corporation (a Delaware corporation) and subsidiaries (the “Company”) as of December 31, 2019, the related consolidated statements of income, comprehensive income, stockholders’ equity, and cash flows for the year ended December 31, 2019, and the related notes (collectively referred to as the “financial statements”). In our opinion, the financial statements present fairly, in all material respects, the financial position of the Company as of December 31, 2019, and the results of its operations and its cash flows for the year ended December 31, 2019, in conformity with accounting principles generally accepted in the United States of America.
We also have audited, in accordance with the standards of the Public Company Accounting Oversight Board (United States) (“PCAOB”), the Company’s internal control over financial reporting as of December 31, 2019, based on criteria established in the 2013 Internal Control-Integrated Framework issued by the Committee of Sponsoring Organizations of the Treadway Commission (“COSO”), and our report dated March 9, 2020 expressed an unqualified opinion.
Change in accounting principle
As discussed in Note 1 to the financial statements, the Company has changed its method of accounting for leases as of January 1, 2019, in accordance with the adoption of Accounting Standards Codification ("ASC") Topic 842, Leases.
Basis for opinion
These financial statements are the responsibility of the Company’s management. Our responsibility is to express an opinion on the Company’s financial statements based on our audit. We are a public accounting firm registered with the PCAOB and are required to be independent with respect to the Company in accordance with the U.S. federal securities laws and the applicable rules and regulations of the Securities and Exchange Commission and the PCAOB.
We conducted our audit in accordance with the standards of the PCAOB. Those standards require that we plan and perform the audit to obtain reasonable assurance about whether the financial statements are free of material misstatement, whether due to error or fraud. Our audit included performing procedures to assess the risks of material misstatement of the financial statements, whether due to error or fraud, and performing procedures that respond to those risks. Such procedures included examining, on a test basis, evidence supporting the amounts and disclosures in the financial statements. Our audit also included evaluating the accounting principles used and significant estimates made by management, as well as evaluating the overall presentation of the financial statements. We believe that our audit provides a reasonable basis for our opinion.
/s/ GRANT THORNTON LLP
We have served as the Company’s auditor since 2019.
Arlington, Virginia | |
March 9, 2020 | |
-31-
Report of Independent Registered Public Accounting Firm
The Board of Directors and Stockholders of VSE Corporation
Opinion on the Financial Statements
We have audited the accompanying consolidated balance sheet of VSE Corporation and Subsidiaries (the Company) as of December 31, 2018, the related consolidated statements of income, comprehensive income, stockholders' equity and cash flows for each of the two years in the period ended December 31, 2018, and the related notes (collectively referred to as the “consolidated financial statements”). In our opinion, the consolidated financial statements present fairly, in all material respects, the financial position of the Company at December 31, 2018, and the results of its operations and its cash flows for each of the two years in the period ended December 31, 2018, in conformity with U.S. generally accepted accounting principles.
Adoption of Accounting Standards Update (ASU) No. 2014-09, Revenue from Contracts with Customers (Topic 606)
As discussed in Note 1 to the consolidated financial statements, the Company changed its method of accounting for revenue in 2018 due to the adoption of Accounting Standards Update (ASU) No. 2014-09, Revenue from Contracts with Customers (Topic 606), and the related amendments.
Basis for Opinion
These financial statements are the responsibility of the Company’s management. Our responsibility is to express an opinion on the Company’s financial statements based on our audits. We are a public accounting firm registered with the PCAOB and are required to be independent with respect to the Company in accordance with the U.S. federal securities laws and the applicable rules and regulations of the Securities and Exchange Commission and the PCAOB.
We conducted our audits in accordance with the standards of the PCAOB. Those standards require that we plan and perform the audit to obtain reasonable assurance about whether the financial statements are free of material misstatement, whether due to error or fraud. Our audits included performing procedures to assess the risks of material misstatement of the financial statements, whether due to error or fraud, and performing procedures that respond to those risks. Such procedures included examining, on a test basis, evidence regarding the amounts and disclosures in the financial statements. Our audits also included evaluating the accounting principles used and significant estimates made by management, as well as evaluating the overall presentation of the financial statements. We believe that our audits provide a reasonable basis for our opinion.
/s/ Ernst & Young LLP
We served as the Company’s auditor from 2002 to 2019.
Tysons, Virginia
March 6, 2019
-32-
VSE Corporation and Subsidiaries
Consolidated Balance Sheets
(in thousands, except share and per share amounts)
As of December 31, | |||||||
2019 | 2018 | ||||||
Assets | |||||||
Current assets: | |||||||
Cash and cash equivalents | $ | 734 | $ | 162 | |||
Receivables, net | 70,630 | 60,004 | |||||
Unbilled receivables, net | 46,279 | 41,255 | |||||
Inventories, net | 218,627 | 166,392 | |||||
Other current assets | 19,071 | 13,407 | |||||
Total current assets | 355,341 | 281,220 | |||||
Property and equipment, net | 43,465 | 49,606 | |||||
Intangible assets, net | 132,175 | 94,892 | |||||
Goodwill | 276,450 | 198,622 | |||||
Operating lease - right-of-use asset | 20,943 | — | |||||
Other assets | 17,490 | 14,488 | |||||
Total assets | $ | 845,864 | $ | 638,828 | |||
Liabilities and Stockholders' equity | |||||||
Current liabilities: | |||||||
Current portion of long-term debt | $ | 16,883 | $ | 9,466 | |||
Accounts payable | 68,099 | 57,408 | |||||
Current portion of earn-out obligations | 31,700 | — | |||||
Accrued expenses and other current liabilities | 46,514 | 37,133 | |||||
Dividends payable | 987 | 871 | |||||
Total current liabilities | 164,183 | 104,878 | |||||
Long-term debt, less current portion | 253,128 | 151,133 | |||||
Deferred compensation | 18,146 | 17,027 | |||||
Long-term lease obligations, less current portion | — | 18,913 | |||||
Long-term lease obligations under operating leases | 24,441 | — | |||||
Earn-out obligations, less current portion | 5,000 | — | |||||
Deferred tax liabilities | 17,865 | 18,482 | |||||
Total liabilities | 482,763 | 310,433 | |||||
Commitments and contingencies (Note 12) | |||||||
Stockholders' equity: | |||||||
Common stock, par value $0.05 per share, authorized 15,000,000 shares; issued and outstanding 10,970,123 and 10,886,036 respectively | 549 | 544 | |||||
Additional paid-in capital | 29,411 | 26,632 | |||||
Retained earnings | 334,246 | 301,073 | |||||
Accumulated other comprehensive income | (1,105 | ) | 146 | ||||
Total stockholders' equity | 363,101 | 328,395 | |||||
Total liabilities and stockholders' equity | $ | 845,864 | $ | 638,828 | |||
The accompanying notes are an integral part of these financial statements.
-33-
VSE Corporation and Subsidiaries
Consolidated Statements of Income
(in thousands, except share and per share amounts)
For the years ended December 31, | |||||||||||
2019 | 2018 | 2017 | |||||||||
Revenues: | |||||||||||
Products | $ | 376,633 | $ | 360,505 | $ | 350,129 | |||||
Services | 375,994 | 336,713 | 409,984 | ||||||||
Total revenues | 752,627 | 697,218 | 760,113 | ||||||||
Costs and operating expenses: | |||||||||||
Products | 321,312 | 303,881 | 291,769 | ||||||||
Services | 347,549 | 321,076 | 395,573 | ||||||||
Selling, general and administrative expenses | 4,192 | 3,714 | 2,429 | ||||||||
Amortization of intangible assets | 19,317 | 16,017 | 16,017 | ||||||||
Total costs and operating expenses | 692,370 | 644,688 | 705,788 | ||||||||
Gain on sale of contract | — | 1,700 | — | ||||||||
Operating income | 60,257 | 54,230 | 54,325 | ||||||||
Interest expense, net | 13,830 | 8,982 | 9,240 | ||||||||
Income before income taxes | 46,427 | 45,248 | 45,085 | ||||||||
Provision for income taxes | 9,403 | 10,168 | 5,989 | ||||||||
Net income | $ | 37,024 | $ | 35,080 | $ | 39,096 | |||||
Basic earnings per share: | $ | 3.38 | $ | 3.23 | $ | 3.61 | |||||
Basic weighted average shares outstanding | 10,957,750 | 10,876,201 | 10,834,562 | ||||||||
Diluted earnings per share: | $ | 3.35 | $ | 3.21 | $ | 3.60 | |||||
Diluted weighted average shares outstanding | 11,044,731 | 10,936,057 | 10,867,834 | ||||||||
The accompanying notes are an integral part of these financial statements.
-34-
VSE Corporation and Subsidiaries
Consolidated Statements of Comprehensive Income
(in thousands)
For the years ended December 31, | |||||||||||
2019 | 2018 | 2017 | |||||||||
Net income | $ | 37,024 | $ | 35,080 | $ | 39,096 | |||||
Change in fair value of interest rate swap agreements, net of tax | (1,251 | ) | (35 | ) | 136 | ||||||
Other comprehensive (loss) income, net of tax | (1,251 | ) | (35 | ) | 136 | ||||||
Comprehensive income | $ | 35,773 | $ | 35,045 | $ | 39,232 | |||||
The accompanying notes are an integral part of these financial statements.
-35-
VSE Corporation and Subsidiaries
Consolidated Statements of Stockholders' Equity
(in thousands except per share data)
Additional Paid-In Capital | Retained Earnings | Accumulated Other Comprehensive Income (Loss) | Total Stockholders' Equity | |||||||||||||||||||
Common Stock | ||||||||||||||||||||||
Shares | Amount | |||||||||||||||||||||
Balance at December 31, 2016 | 10,799 | $ | 540 | $ | 22,876 | $ | 231,733 | $ | 45 | $ | 255,194 | |||||||||||
Net income | — | — | — | 39,096 | — | 39,096 | ||||||||||||||||
Stock-based compensation | 40 | 2 | 1,594 | — | — | 1,596 | ||||||||||||||||
Change in fair value of interest rate swap agreements, net of tax | — | — | — | — | 136 | 136 | ||||||||||||||||
Dividends declared ($0.27 per share) | — | — | — | (2,927 | ) | — | (2,927 | ) | ||||||||||||||
Balance at December 31, 2017 | 10,839 | 542 | 24,470 | 267,902 | 181 | 293,095 | ||||||||||||||||
Cumulative effect of adoption of ASU 2014-09, net of tax | — | — | — | 1,465 | — | 1,465 | ||||||||||||||||
Net income | — | — | — | 35,080 | — | 35,080 | ||||||||||||||||
Stock-based compensation | 47 | 2 | 2,162 | — | — | 2,164 | ||||||||||||||||
Change in fair value of interest rate swap agreements, net of tax | — | — | — | — | (35 | ) | (35 | ) | ||||||||||||||
Dividends declared ($0.31 per share) | — | — | — | (3,374 | ) | — | (3,374 | ) | ||||||||||||||
Balance at December 31, 2018 | 10,886 | 544 | 26,632 | 301,073 | 146 | 328,395 | ||||||||||||||||
Cumulative effect of adoption of ASU 2016-02, net of tax | — | — | — | (9 | ) | — | (9 | ) | ||||||||||||||
Net income | — | — | — | 37,024 | — | 37,024 | ||||||||||||||||
Stock-based compensation | 84 | 5 | 2,779 | — | — | 2,784 | ||||||||||||||||
Change in fair value of interest rate swap agreements, net of tax | — | — | — | — | (1,251 | ) | (1,251 | ) | ||||||||||||||
Dividends declared ($0.35 per share) | — | — | — | (3,842 | ) | — | (3,842 | ) | ||||||||||||||
Balance at December 31, 2019 | 10,970 | $ | 549 | $ | 29,411 | $ | 334,246 | $ | (1,105 | ) | $ | 363,101 | ||||||||||
The accompanying notes are an integral part of these financial statements.
-36-
VSE Corporation and Subsidiaries
Consolidated Statements of Cash Flows
(in thousands)
For the years ended December 31, | |||||||||||
2019 | 2018 | 2017 | |||||||||
Cash flows from operating activities: | |||||||||||
Net income | $ | 37,024 | $ | 35,080 | $ | 39,096 | |||||
Adjustments to reconcile net income to net cash provided by operating activities: | |||||||||||
Depreciation and amortization | 26,927 | 25,224 | 25,882 | ||||||||
Deferred taxes | (505 | ) | (1,371 | ) | (10,534 | ) | |||||
Stock-based compensation | 3,264 | 3,027 | 3,068 | ||||||||
Gain on sale of contract | — | (1,700 | ) | — | |||||||
Earn-out obligation adjustment | 1,900 | — | — | ||||||||
Changes in operating assets and liabilities, net of impact of acquisitions: | |||||||||||
Receivables | (3,331 | ) | (3,754 | ) | (91 | ) | |||||
Unbilled receivables | (4,593 | ) | 4,706 | 2,972 | |||||||
Inventories | (44,219 | ) | (35,558 | ) | 3,749 | ||||||
Other current assets and noncurrent assets | (7,405 | ) | 4,789 | 3,681 | |||||||
Accounts payable and deferred compensation | 7,725 | (7,405 | ) | (23,587 | ) | ||||||
Accrued expenses and other current liabilities | 1,207 | (2,515 | ) | 7,562 | |||||||
Long-term lease obligations | — | (1,668 | ) | (1,378 | ) | ||||||
Net cash provided by operating activities | 17,994 | 18,855 | 50,420 | ||||||||
Cash flows from investing activities: | |||||||||||
Purchases of property and equipment | (9,630 | ) | (3,117 | ) | (3,743 | ) | |||||
Proceeds from the sale of property and equipment | 4 | 122 | 732 | ||||||||
Proceeds from the sale of contract | — | 1,700 | — | ||||||||
Cash paid for acquisitions, net of cash acquired | (113,181 | ) | — | — | |||||||
Net cash used in investing activities | (122,807 | ) | (1,295 | ) | (3,011 | ) | |||||
Cash flows from financing activities: | |||||||||||
Borrowings on loan agreement | 752,259 | 539,471 | 348,675 | ||||||||
Repayments on loan agreement | (642,193 | ) | (550,436 | ) | (391,285 | ) | |||||
Payment of debt financing costs | — | (1,702 | ) | — | |||||||
Payments on financing lease obligations | — | (1,452 | ) | (1,287 | ) | ||||||
Payment of taxes for equity transactions | (955 | ) | (641 | ) | (500 | ) | |||||
Dividends paid | (3,726 | ) | (3,262 | ) | (2,816 | ) | |||||
Net cash provided by (used in) financing activities | 105,385 | (18,022 | ) | (47,213 | ) | ||||||
Net increase (decrease) in cash and cash equivalents | 572 | (462 | ) | 196 | |||||||
Cash and cash equivalents at beginning of year | 162 | 624 | 428 | ||||||||
Cash and cash equivalents at end of year | $ | 734 | $ | 162 | $ | 624 | |||||
Supplemental cash flow disclosures: | |||||||||||
Cash paid for: | |||||||||||
Interest | $ | 13,468 | $ | 7,523 | $ | 7,606 | |||||
Income taxes | $ | 11,645 | $ | 9,534 | $ | 16,346 | |||||
The accompanying notes are an integral part of these financial statements.
-37-
VSE Corporation and Subsidiaries
Notes to Consolidated Financial Statements
December 31, 2019
(1) Nature of Business and Significant Accounting Policies
Nature of Business
The term "VSE," the "Company," "us," "we," or "our" means VSE and its subsidiaries and divisions unless the context indicates operations of only VSE as the parent company.
Our operations include aftermarket supply chain management solutions and parts supply for vehicle fleets; maintenance, repair, and overhaul ("MRO") services and parts supply for aviation clients; vehicle and equipment maintenance and refurbishment; logistics; engineering; energy services; IT and health care IT solutions; and consulting services. We serve the United States Government (the "government"), including the United States Department of Defense ("DoD"), federal civilian agencies, and commercial and other customers.
Principles of Consolidation
The consolidated financial statements consist of the operations of our parent company, our wholly owned subsidiaries, Energetics Incorporated ("Energetics"), Akimeka, LLC ("Akimeka"), Wheeler Bros., Inc. ("WBI") and VSE Aviation, Inc. ("VSE Aviation"), and our unincorporated divisions. All intercompany transactions have been eliminated in consolidation.
Use of Estimates in the Preparation of Financial Statements
The preparation of financial statements in conformity with generally accepted accounting principles in the United States ("U.S. GAAP") requires us to make estimates and assumptions that affect the reported amounts of assets and liabilities and disclosure of contingent assets and liabilities at the date of the financial statements and the reported amounts of revenues and expenses during the reporting period. Actual results could differ from those estimates. Significant estimates affecting the financial statements include accruals for contract disallowance reserves, recoverability of goodwill and intangible assets, and earn-out obligations.
Recently Adopted Accounting Pronouncements
In February 2016, the Financial Accounting Standards Board ("FASB") issued Accounting Standards Update ("ASU") No. 2016-02, Leases (Topic 842) ("ASC 842"), to increase transparency and comparability among organizations by recognizing lease assets and lease liabilities on the balance sheet and disclosing key information about leasing arrangements. The new standard is required to be adopted using a modified retrospective method and is effective for reporting periods beginning after December 15, 2018, with early adoption permitted. In July 2018, the FASB provided an alternative transition method of adoption through ASU No. 2018-11, Targeted Improvements, which provides entities with an optional transition method to apply the transition provisions of ASU 2016-02 at the beginning of the period of adoption.
On January 1, 2019, we adopted ASC 842 using the alternative transition method provided by ASU 2018-11 recording right-of-use assets and lease liabilities for our existing leases as of January 1, 2019, as well as a cumulative-effect adjustment to retained earnings of initially applying the new standard as of January 1, 2019. We have elected the package of practical expedients permitted under the transition guidance, which does not require reassessment of prior conclusions related to lease identification, lease classification, and treatment for initial direct lease costs. We have not elected the practical expedients pertaining to the use of hindsight and land easements.
The adoption of the new lease standard resulted in the recharacterization of our headquarters lease, which was accounted for using the financing method under previously existing build-to-suit accounting rules, to an operating lease under ASC 842. Upon adoption of the new lease standard on January 1, 2019, we derecognized existing liabilities of approximately $20.3 million and fixed assets of $15.2 million and recorded a right-of-use asset of $21.3 million, property and equipment of $2.8 million, and operating lease liability of $29.6 million, with immaterial changes to other balance sheet accounts. The recharacterization resulted in an immaterial cumulative-effect adjustment to retained earnings, net of taxes, as of January 1, 2019. The new standard did not have a significant impact on our consolidated results of operations or cash flows. Certain amounts for our ASC 842 adoption have been adjusted to conform to the current period presentation. These adjustments have no effect on our reported financial condition, results of operations, or cash flows. Financial information for periods prior to January 1, 2019, has not been restated for the adoption of ASU 2016-02.
-38-
Stock-Based Compensation
We account for share-based awards in accordance with the applicable accounting rules that require the measurement and recognition of compensation expense for all share-based payment awards based on estimated fair values. The compensation expense included in costs and operating expenses is amortized over the requisite service period using the accelerated attribution method.
Earnings Per Share
Basic earnings per share ("EPS") is computed by dividing net income by the weighted average number of shares of common stock outstanding during each period. Shares issued during the period are weighted for the portion of the period that they were outstanding. Our calculation of diluted earnings per common share includes the dilutive effects for the assumed vesting of restricted stock awards.
Years Ended December 31, | ||||||||
2019 | 2018 | 2017 | ||||||
Basic weighted average common shares outstanding | 10,957,750 | 10,876,201 | 10,834,562 | |||||
Effect of dilutive shares | 86,981 | 59,856 | 33,272 | |||||
Diluted weighted average common shares outstanding | 11,044,731 | 10,936,057 | 10,867,834 | |||||
Cash and Cash Equivalents
We consider all highly liquid investments with an original maturity of three months or less to be cash equivalents. Due to the short maturity of these instruments, the carrying values on our consolidated balance sheets approximate fair value.
Property and Equipment
Property and equipment are recorded at cost. Depreciation of computer equipment, furniture, other equipment is provided principally by the straight-line method over periods of three to 15 years. Depreciation of buildings and land improvements is provided by the straight-line method over periods of approximately 15 to 20 years. Amortization of leasehold improvements is provided by the straight-line method over the lesser of their useful life or the remaining term of the lease.
Concentration of Credit Risk/Fair Value of Financial Instruments
Financial instruments that potentially subject us to concentration of credit risk consist primarily of cash, cash equivalents and trade receivables. Our trade receivables consist of amounts due from various government clients and commercial entities. We believe that concentrations of credit risk with respect to trade receivables are limited due to the large number of customers comprising the customer base and their dispersion across many different geographic regions. Contracts with the government, either as a prime or subcontractor, accounted for approximately 68%, 78%, and 82% of revenues for the years ended December 31, 2019, 2018 and 2017, respectively. The credit risk, with respect to contracts with the government, is limited due to the creditworthiness of the respective governmental entity. We perform ongoing credit evaluations and monitoring of the financial condition of all our customers. We believe that the fair market value of all financial instruments, including debt, approximate book value.
Revenues for 2019 and 2018
On January 1, 2018, we adopted ASC 606 using the modified retrospective method applied to those contracts which were not completed as of January 1, 2018, including the aggregate effect of modifications to such contracts through January 1, 2018. Results for reporting periods beginning after January 1, 2018 are presented under the new guidance, while prior period amounts are not adjusted and continue to be reported in accordance with previous guidance.
We account for revenue in accordance with ASC 606. The unit of account in ASC 606 is a performance obligation. At the inception of each contract with a customer, we determine our performance obligations under the contract and the contract's transaction price. A performance obligation is a promise in a contract to transfer a distinct good or service to the customer and is defined as the unit of account. A contract’s transaction price is allocated to each distinct performance obligation and recognized as revenue when the performance obligation is satisfied. The majority of our contracts have a single performance obligation as the promise to transfer the respective goods or services is not separately identifiable from other promises in the contracts and is, therefore, not distinct. For product sales, each product sold to a customer typically represents a distinct performance obligation.
-39-
Our performance obligations are satisfied over time as work progresses or at a point in time based on transfer of control of products and services to our customers.
Contract modifications are routine in the performance of our contracts. Contracts are often modified to account for changes in contract specifications or requirements. In most instances, contract modifications are for goods or services that are not distinct, and therefore are accounted for as part of the existing contract.
Substantially all our Supply Chain Management Group revenues from the sale of vehicle parts to customers is recognized at the point in time of the transfer of control to the customer. Sales returns and allowances for vehicle parts are not significant.
Our Aviation Group revenues result from the sale of aircraft parts and performance of MRO services for private and commercial aircraft owners, other aviation MRO providers, and aviation original equipment manufacturers. Our Aviation Group recognizes revenues for the sale of aircraft parts at a point in time when control is transferred to the customer, which usually occurs when the parts are shipped. Our Aviation Group recognizes revenues for MRO services over time as the services are transferred to the customer. MRO services revenue recognized is measured based on the cost-to-cost input method, as costs incurred reflect the work completed, and therefore the services transferred to date. Sales returns and allowances are not significant.
Our Federal Services Group revenues result from professional and technical services, which we perform for customers on a contract basis. Revenue is recognized for performance obligations over time as we transfer the services to the customer. The three primary types of contracts used are cost-type, fixed-price and time and materials. Revenues result from work performed on these contracts by our employees and our subcontractors and from costs for materials and other work-related costs allowed under our contracts.
Revenues on cost-type contracts are recorded as contract allowable costs are incurred and fees are earned. Variable consideration, typically in the form of award fees, is included in the estimated transaction price, to the extent that it is probable that a significant reversal will not occur, when there is a basis to reasonably estimate the amount of the fee. These estimates are based on historical award experience, anticipated performance and our best judgment based on current facts and circumstances.
Revenues on fixed-price contracts are recorded as work is performed over the period. Revenue is recognized over time using costs incurred to date relative to total estimated costs at completion to measure progress toward satisfying our performance obligations. Incurred cost represents work performed, which corresponds with the transfer of control to the customer. For such contracts, we estimate total costs at the inception of the contract based on our assumptions of the cost elements required to complete the associated tasks of the contract and assess the impact of the risks on our estimates of total costs to complete the contract. Our cost estimates are based on assumptions that include the complexity of the work, our employee labor costs, the cost of materials and the performance of our subcontractors. These cost estimates are subject to change as we perform under the contract and as a result, the timing of revenues and amount of profit on a contract may change as there are changes in estimated costs to complete the contract. Such adjustments are recognized on a cumulative catch-up basis in the period we identify the changes.
Revenues for time and materials contracts are recorded based on the amount for which we have the right to invoice our customers, because the amount directly reflects the value of our work performed for the customer. Revenues are recorded on the basis of contract allowable labor hours worked multiplied by the contract defined billing rates, plus the direct costs and indirect cost burdens associated with materials and subcontract work used in performance on the contract. Generally, profits on time and materials contracts result from the difference between the cost of services performed and the contract defined billing rates for these services.
Revenues related to work performed on government contracts at risk, which is work performed at the customer's request prior to the government formalizing funding, is not recognized until it can be reliably estimated and its realization is probable.
A substantial portion of contract and administrative costs are subject to audit by the Defense Contract Audit Agency. Our indirect cost rates have been audited and approved for 2013 and prior years with no material adjustments to our results of operations or financial position. While we maintain reserves to cover the risk of potential future audit adjustments based primarily on the results of prior audits, we do not believe any future audits will have a material adverse effect on our results of operations, financial position, or cash flows.
-40-
Revenues for 2017
Revenue is recognized when persuasive evidence of an arrangement exists, delivery has occurred or services have been rendered, the fee is fixed or determinable, and collectability is probable.
Substantially all of our Supply Chain Management Group revenues result from the sale of vehicle parts to clients. We recognize revenue from the sale of vehicle parts when the customer takes ownership of the parts. Sales returns and allowances are not significant.
Our Aviation Group revenues are recognized upon the shipment or delivery of products to customers based on when title or risk of loss transfers to the customer. Sales returns and allowances are not significant.
Substantially all of our Federal Services work is performed for our customers on a contract basis. The three primary types of contracts used are cost-type, fixed-price and time and materials. Revenues result from work performed on these contracts by our employees and our subcontractors and from costs for materials and other work related costs allowed under our contracts.
Revenues on cost-type contracts are recorded as contract allowable costs are incurred and fees are earned. Our FMS Program contract is a cost plus award fee contract. This contract has terms that specify award fee payments that are determined by performance and level of contract activity. Award fees are made during the year through a contract modification authorizing the award fee that is issued subsequent to the period in which the work is performed. We recognize award fee income on the FMS Program contract when the fees are fixed or determinable. Due to such timing and fluctuations in the level of revenues, profits as a percentage of revenues on this contract will fluctuate from period to period.
Revenue recognition methods on fixed-price contracts will vary depending on the nature of the work and the contract terms. Revenues on fixed-price service contracts are recorded as work is performed, typically ratably over the service period. Revenues on fixed price contracts that require delivery of specific items are recorded based on a price per unit as units are delivered.
Revenues for time and materials contracts are recorded on the basis of contract allowable labor hours worked multiplied by the contract defined billing rates, plus the direct costs and indirect cost burdens associated with materials and subcontract work used in performance on the contract. Generally, profits on time and materials contracts result from the difference between the cost of services performed and the contract defined billing rates for these services.
Receivables and Allowance for Doubtful Accounts
Receivables are recorded at amounts earned less an allowance for doubtful accounts. We review our receivables regularly to determine if there are any potentially uncollectible accounts. The majority of our receivables are from government agencies, where there is minimal credit risk. We record allowances for bad debt as a reduction to receivables and an increase to bad debt expense. We assess the adequacy of these reserves by considering general factors, such as the length of time individual receivables are past due and historical collection experience.
Unbilled Receivables
Unbilled receivables include amounts typically resulting from sales under contracts when the cost-to-cost method of revenue recognition is utilized and revenue recognized exceeds the amount billed to the customer. The amounts may not exceed their estimated net realizable value. Unbilled receivables are classified as current based on our contract operating cycle.
Inventories
Inventories for our Supply Chain Group are stated at the lower of cost or net realizable value using the first-in, first-out ("FIFO") method. Included in inventory are related purchasing, storage and handling costs. Our inventory primarily consists of vehicle replacement parts.
Inventories for our Aviation Group are stated at lower of cost or net realizable value. Inventories for our Aviation Group primarily consist of aftermarket parts for distribution, general aviation jet aircraft engines and engine accessories and parts. The cost for purchased engines and parts is determined by the specific identification method. Included in inventory are related purchasing, overhaul labor, storage and handling costs. We also purchase aircraft engines for disassembly into individual parts and components.
-41-
Deferred Compensation Plans
We have a deferred compensation plan, the VSE Corporation Deferred Supplemental Compensation Plan ("DSC Plan"), to provide incentive and reward for certain key management employees based on overall corporate performance. We maintain the underlying assets of the DSC Plan in a Rabbi Trust and changes in asset values are included in costs and operating expenses on the accompanying consolidated statements of income. We invest the assets held by the Rabbi Trust in both corporate owned life insurance ("COLI") products and in mutual funds. The COLI investments are recorded at cash surrender value and the mutual fund investments are recorded at fair value. The DSC Plan assets are included in other assets and the obligation to the participants is included in deferred compensation on the accompanying consolidated balance sheets.
Deferred compensation plan expense recorded as costs and operating expenses in the accompanying consolidated statements of income for the years ended December 31, 2019, 2018 and 2017 was approximately $1.7 million, $2.1 million and $1.9 million, respectively.
Impairment of Long-Lived Assets
Long-lived assets include amortizable intangible assets and property and equipment to be held and used. We review the carrying values of long-lived assets other than goodwill for impairment if events or changes in the facts and circumstances indicate that their carrying values may not be recoverable. We assess impairment by comparing the estimated undiscounted future cash flows of the related asset to its carrying value. If an asset is determined to be impaired, we recognize an impairment charge in the current period for the difference between the fair value of the asset and its carrying value.
No impairment charges related to long-lived assets were recorded in the years ended December 31, 2019, December 31, 2018 and December 31, 2017.
Income Taxes
Income taxes are accounted for under the asset and liability method. Under the asset and liability method, deferred tax assets and liabilities are recognized for the estimated future tax consequences attributable to differences between the financial statement carrying amounts of existing assets and liabilities and their respective tax basis. This method also requires the recognition of future tax benefits, such as net operating loss carryforwards, to the extent that realization of such benefits is more likely than not. Deferred tax assets and liabilities are measured using enacted tax rates expected to apply to taxable income in the years in which those temporary differences are expected to be recovered or settled. The effect on deferred tax assets and liabilities of a change in tax rates is recognized in income in the period that includes the enactment date.
The carrying value of net deferred tax assets is based on assumptions regarding our ability to generate sufficient future taxable income to utilize these deferred tax assets.
Goodwill
We test goodwill for impairment annually in the fourth quarter and whenever events or changes in circumstances indicate the carrying value of goodwill may not be recoverable. Goodwill is tested for impairment at the reporting unit level. A qualitative assessment can be performed to determine whether it is more likely than not that the fair value of the reporting unit is less than its carrying value. If the reporting unit does not pass the qualitative assessment, we compare the fair value of each reporting unit to its carrying value using a quantitative assessment. If the fair value of the reporting unit exceeds its carrying value, goodwill is considered not impaired. If the fair value of the reporting unit is less than the carrying value, the difference is recorded as an impairment loss.
For the quantitative assessment, we estimate the fair value of each reporting unit using a combination of an income approach using a discounted cash flow ("DCF") analysis and a market-based valuation approach based on comparable public company trading values. Determining the fair value of a reporting unit requires the exercise of significant management judgments, including the amount and timing of projected future revenues, earnings and cash flows, discount rates, long-term growth rates and comparable public company revenues and earnings multiples. The projected results used in our quantitative assessment are based on our best estimate as of the testing date of future revenues, earnings and cash flows after considering factors such as recent operating performance, general market and industry conditions, existing and expected future contracts, changes in working capital and long-term business plans and growth initiatives. The carrying value of each reporting unit includes the assets and liabilities
-42-
employed in its operations and goodwill. There are no significant allocations of amounts held at the Corporate level to the reporting units.
Based on our annual goodwill impairment analysis we performed in the fourth quarter of 2019, the fair value of our reporting units exceeded their carrying values.
Intangible Assets
Intangible assets consist of the value of contract-related intangible assets, trade names and acquired technologies acquired in acquisitions. We amortize intangible assets on a straight-line basis over their estimated useful lives unless their useful lives are determined to be indefinite. The amounts we record related to acquired intangibles are determined by us considering the results of independent valuations. Our contract-related intangibles are amortized over their estimated useful lives of approximately five to 18 years with a weighted-average life of approximately 13.9 years as of December 31, 2019. We have six trade names that are amortized over an estimated useful life of approximately two to nine years. We have an acquired technologies intangible asset that is amortized over an estimated useful life of 11 years. The weighted-average life for all amortizable intangible assets is approximately 13.4 years as of December 31, 2019.
Recently Issued Accounting Pronouncements Not Yet Adopted
In June 2016, the FASB issued ASU No. 2016-13, Measurement of Credit Losses on Financial Instruments, which changes the methodology for measuring credit losses on financial instruments and the timing of when such losses are recorded. The new standard is effective for reporting periods beginning after December 15, 2019. We have adopted the new standard effective January 1, 2020. We do not anticipate that the adoption of the new standard will have a significant impact on our operating results, financial position or cash flows.
In August 2018, the FASB issued ASU No. 2018-13, Disclosure Framework-Changes to the Disclosure Requirements for Fair Value Measurement, which eliminates certain disclosures related to transfers and the valuations process, modifies disclosures for investments that are valued based on net asset value, clarifies the measurement uncertainty disclosure, and requires additional disclosures for Level 3 fair value measurements. The new standard is effective for fiscal years beginning after December 15, 2019 with early adoption permitted. We currently are assessing the impact this standard will have on our consolidated financial statements.
In August 2018, the FASB issued ASU No. 2018-15, Customer’s Accounting for Implementation Costs Incurred in a Cloud Computing Arrangement That Is a Service Contract, which clarifies the accounting for implementation costs in cloud computing arrangements. The new standard is effective for fiscal years beginning after December 15, 2019. We have adopted the new standard effective January 1, 2020. We do not anticipate that the adoption of the new standard will have a significant impact on our operating results, financial position or cash flows.
(2) Acquisition
On January 10, 2019, our wholly owned subsidiary VSE Aviation, Inc. ("VSE Aviation") acquired 100% of the equity of 1st Choice Aerospace Inc. ("1st Choice Aerospace"), a provider of MRO services and products for new generation and legacy commercial aircraft platforms. 1st Choice Aerospace has operations in Florida and Kentucky. Key members of 1st Choice Aerospace's management team were retained under three-year employment contracts with five-year non-compete covenants.
The initial purchase consideration paid at closing for 1st Choice Aerospace was approximately $113 million, which included $1.1 million as an estimated net working capital adjustment. We will also be required to make earn-out payments of up to $40 million if 1st Choice Aerospace meets certain financial targets during 2019 and 2020. Approximately $1.1 million of our closing payments were deposited into an escrow account to secure the sellers' indemnification obligations. Any amount remaining in such escrow account at the end of the indemnification period less any then pending indemnification claims will be distributed to the sellers. 1st Choice Aerospace's results of operations are included in our Aviation Group in the accompanying consolidated financial statements beginning on the acquisition date of January 10, 2019. 1st Choice Aerospace had revenues of approximately $63.0 million and operating income of approximately $14.0 million before amortization of intangible assets of approximately $3.3 million and allocated corporate costs of approximately $1.7 million from the acquisition date through December 31, 2019.
-43-
The purchase accounting entries above include the impact of the Section 338(h)(10) election under the current U.S. tax code. We reflected the $1.7 million impact of this election in the purchase price. Our tax advantages resulting from the 338(h) (10) election are expected to significantly exceed the additional payment that was made to the sellers.
We completed our purchase price allocation. During the year ended December 31, 2019, we recorded an increase to goodwill of $17.2 million related to measurement-period adjustments to the preliminary purchase price allocation. The measurement-period adjustments were primarily related to reduction of $5.9 million to the valuation of intangibles - trade name, as well as a $9.8 million and $1.7 million adjustments to the fair value of the earn-out obligation and Section 338(h)(10) election, respectively, that increased the purchase price. The measurement-period adjustments were not significant to our previously reported consolidated results of operations or cash flows.
The fair values assigned to our earn-out obligation and intangible assets acquired were based on estimates, assumptions, and other information compiled by management, including independent valuations that utilized established valuation techniques. Based on the Company's valuation, the total consideration of approximately $113 million (excluding any earn-out payments), which includes a final cash and net working capital consideration of $1.1 million, has been allocated to assets acquired (including identifiable intangible assets and goodwill) and liabilities assumed, as follows (in thousands):
Description | Fair Value | |||
Accounts receivable | $ | 7,295 | ||
Unbilled receivables | 431 | |||
Inventories | 8,016 | |||
Prepaid expenses and other current assets | 766 | |||
Property and equipment | 4,521 | |||
Intangibles - customer related | 54,500 | |||
Intangibles - trade name | 2,100 | |||
Goodwill | 77,828 | |||
Operating lease right-of-use assets | 2,594 | |||
Other assets | 333 | |||
Other current liabilities | (6,576 | ) | ||
Long-term operating lease liabilities | (2,127 | ) | ||
$ | 149,681 | |||
Cash consideration | $ | 113,181 | ||
Acquisition date estimated fair value of earn-out obligation | 34,800 | |||
Section 338(h)(10) election | 1,700 | |||
Total | $ | 149,681 | ||
The value attributed to customer relationships is being amortized on a straight-line basis using weighted average useful lives of 18 years. The value attributed to trade name is being amortized on a straight-line basis over five years. The amount of goodwill recorded for our 1st Choice Aerospace acquisition was approximately $77.8 million, all of which is expected to be amortizable for income tax purposes. The goodwill recognized reflects the strategic advantage of expanding our sustainment services into the aviation supply chain market.
We incurred approximately $408 thousand of acquisition-related expenses for the year ended December 31, 2019, which are included in selling, general and administrative expenses. The following VSE consolidated pro forma results are prepared as if the 1st Choice Aerospace acquisition had occurred on January 1, 2018. Significant pro forma adjustments incorporated into the pro forma results below include the recognition of additional amortization expense related to acquired intangible assets and additional interest expense related to debt incurred to finance the acquisition. Significant nonrecurring adjustments include the elimination of non-recurring acquisition-related expenses incurred during the year ended December 31, 2019. This information is for comparative purposes only and does not necessarily reflect the results that would have occurred or may occur in the future.
-44-
The unaudited consolidated pro forma results of operations are as follows (in thousands except per share amounts):
Year ended December 31, | ||||||||||
2018 | ||||||||||
Revenue | $ | 743,347 | ||||||||
Net Income | $ | 35,963 | ||||||||
Basic earnings per share | $ | 3.31 | ||||||||
Diluted earnings per share | $ | 3.29 | ||||||||
(3) Revenue Recognition
Disaggregated Revenue
Our revenues are derived from contract services performed for DoD agencies or federal civilian agencies and from the delivery of products to our clients. Our customers also include various other government agencies and commercial entities.
-45-
A summary of revenues for our operating groups by customer for the year ended December 31, 2019 is as follows (in thousands):
Customer | Supply Chain Management | Aviation | Federal Services | Total | ||||||||||||
DoD | 24,246 | 3,775 | 276,313 | 304,334 | ||||||||||||
Other government | 168,113 | 1,885 | 35,777 | 205,775 | ||||||||||||
Commercial | 22,161 | 218,886 | 1,471 | 242,518 | ||||||||||||
$ | 214,520 | $ | 224,546 | $ | 313,561 | $ | 752,627 | |||||||||
A summary of revenues for our operating groups by customer for the year ended December 31, 2018 is as follows (in thousands):
Customer | Supply Chain Management | Aviation | Federal Services | Total | ||||||||||||
DoD | 24,280 | 7,387 | 302,827 | 334,494 | ||||||||||||
Other government | 176,200 | 2,172 | 33,746 | 212,118 | ||||||||||||
Commercial | 14,329 | 135,864 | 413 | 150,606 | ||||||||||||
$ | 214,809 | $ | 145,423 | $ | 336,986 | $ | 697,218 | |||||||||
A summary of revenues for our operating groups by contract type for the year ended December 31, 2019 is as follows (in thousands):
Contract Type | Supply Chain Management | Aviation | Federal Services | Total | ||||||||||||
Cost-type | $ | — | $ | 696 | $ | 144,600 | $ | 145,296 | ||||||||
Fixed-price | 214,520 | 104,806 | 78,163 | 397,489 | ||||||||||||
Time and materials | — | 119,044 | 90,798 | 209,842 | ||||||||||||
Total revenues | $ | 214,520 | $ | 224,546 | $ | 313,561 | $ | 752,627 | ||||||||
-46-
A summary of revenues for our operating groups by contract type for the year ended December 31, 2018 is as follows (in thousands):
Contract Type | Supply Chain Management | Aviation | Federal Services | Total | ||||||||||||
Cost-type | $ | — | $ | 4,863 | $ | 188,867 | $ | 193,730 | ||||||||
Fixed-price | 214,809 | 84,600 | 70,669 | 370,078 | ||||||||||||
Time and materials | — | 55,960 | 77,450 | 133,410 | ||||||||||||
Total revenues | $ | 214,809 | $ | 145,423 | $ | 336,986 | $ | 697,218 | ||||||||
Contract Balances
Billed receivables, unbilled receivables (contract assets), and contract liabilities are the results of revenue recognition, customer billing, and timing of payment receipts. Billed receivables, net, represent unconditional rights to consideration under the terms of the contract and include amounts billed and currently due from our customers. Unbilled receivables represent our right to consideration in exchange for goods or services that we have transferred to the customer prior to us having the right to payment for such goods or services. Contract liabilities are recorded when customers remit contractual cash payments in advance of us satisfying performance obligations under contractual arrangements, including those with performance obligations to be satisfied over a period of time.
We present our unbilled receivables and contract liabilities on a contract-by-contract basis. If a contract liability exists, it is netted against the unbilled receivables balance for that contract. Unbilled receivables increased from $41.3 million at December 31, 2018 to $46.3 million at December 31, 2019, primarily due to revenue recognized in excess of billings. Contract liabilities, which are included in accrued expenses and other current liabilities in our consolidated balance sheet, were $5.0 million at December 31, 2018 and $5.0 million at December 31, 2019. For the year ended December 31, 2019 and 2018, we recognized revenue of $2.2 million and $7.9 million, respectively, that was previously included in the beginning balance of contract liabilities.
Performance Obligations
Our performance obligations are satisfied over time as work progresses or at a point in time. Revenues from products and services transferred to customers over time accounted for approximately 57% of our revenues for the year ended December 31, 2019 and 2018, primarily related to revenues in our Federal Services Group and for MRO services in our Aviation Group. Revenues from products and services transferred to customers at a point in time accounted for approximately 43% of our revenues for the year ended December 31, 2019 and 2018. The majority of our revenue recognized at a point in time is for the sale of vehicle and aircraft parts in our Supply Chain Management and Aviation groups.
As of December 31, 2019, the aggregate amount of transaction prices allocated to unsatisfied or partially unsatisfied performance obligations was $213 million. Performance obligations expected to be satisfied within one year and greater than one year are 95% and 5%, respectively. We have applied the practical expedient for certain parts sales and MRO services to exclude the amount of remaining performance obligations for (i) contracts with an original expected term of one year or less or (ii) contracts for which we recognize revenue in proportion to the amount we have the right to invoice for services performed.
During the year ended December 31, 2019, revenue recognized from performance obligations satisfied in prior periods was not material.
(4) Receivables and Unbilled Receivables
Receivables, net and unbilled receivables, net as of December 31, 2019 and 2018, respectively, were as follows (in thousands):
2019 | 2018 | ||||||
Receivables, net | $ | 70,630 | $ | 60,004 | |||
Unbilled receivables, net | 46,279 | 41,255 | |||||
$ | 116,909 | $ | 101,259 | ||||
Receivables, net are recorded at face value less an allowance for doubtful accounts of approximately $396 thousand and $79 thousand as of December 31, 2019 and 2018, respectively.
The unbilled receivables balance includes certain costs for work performed at risk but which we believe will be funded by the government totaling approximately $15.2 million and $4.7 million as of December 31, 2019 and 2018, respectively. We expect to invoice substantially all unbilled receivables during 2020.
(5) Other Current Assets and Other Assets
At December 31, 2019 and 2018, other current assets primarily consisted of vendor advances, prepaid rents and deposits, prepaid income taxes, software licenses, prepaid maintenance agreements and deferred contract costs. At December 31, 2019 and 2018, other assets primarily consisted of deferred compensation plan assets.
(6) Property and Equipment
Property and equipment, net consisted of the following as of December 31, 2019 and 2018 (in thousands):
-47-
2019 | 2018 | ||||||
Buildings and building improvements | $ | 31,463 | $ | 53,121 | |||
Computer equipment | 26,697 | 26,489 | |||||
Furniture, fixtures, equipment and other | 38,637 | 32,991 | |||||
Leasehold improvements | 3,717 | 600 | |||||
Land and land improvements | 5,151 | 4,551 | |||||
105,665 | 117,752 | ||||||
Less accumulated depreciation and amortization | (62,200 | ) | (68,146 | ) | |||
Total property and equipment, net | $ | 43,465 | $ | 49,606 | |||
Depreciation and amortization expense for property and equipment for the years ended December 31, 2019, 2018 and 2017 was approximately $7.0 million, $8.5 million and $9.3 million, respectively.
(7) Goodwill and Intangible Assets
Changes in goodwill for the years ended December 31, 2019 and 2018 are as follows (in thousands):
Supply Chain Management | Federal Services | Aviation | Total | ||||||||||||
Balance as of December 31, 2017 | $ | 63,190 | $ | 30,883 | $ | 104,549 | $ | 198,622 | |||||||
Increase from acquisitions | — | — | — | — | |||||||||||
Balance as of December 31, 2018 | $ | 63,190 | $ | 30,883 | $ | 104,549 | $ | 198,622 | |||||||
Increase from acquisitions | — | — | 77,828 | 77,828 | |||||||||||
Balance as of December 31, 2019 | $ | 63,190 | $ | 30,883 | $ | 182,377 | $ | 276,450 | |||||||
The results of our annual goodwill impairment testing in the fourth quarter of 2019 indicated that the fair value of our reporting units exceeded their carrying values.
Intangible assets consist of the value of contract-related assets, technologies and trade names. Amortization expense for the years ended December 31, 2019, 2018 and 2017 was approximately $19.3 million, $16.0 million and $16.0 million, respectively.
Intangible assets were comprised of the following (in thousands):
Cost | Accumulated Amortization | Accumulated Impairment Loss | Net Intangible Assets | ||||||||||||
December 31, 2019 | |||||||||||||||
Contract and customer-related | $ | 227,594 | $ | (102,169 | ) | $ | (1,025 | ) | $ | 124,400 | |||||
Acquired technologies | 12,400 | (9,660 | ) | — | 2,740 | ||||||||||
Trade names | 18,770 | (13,735 | ) | — | 5,035 | ||||||||||
Total | $ | 258,764 | $ | (125,564 | ) | $ | (1,025 | ) | $ | 132,175 | |||||
December 31, 2018 | |||||||||||||||
Contract and customer-related | $ | 173,094 | $ | (86,076 | ) | $ | (1,025 | ) | $ | 85,993 | |||||
Acquired technologies | 12,400 | (8,533 | ) | — | 3,867 | ||||||||||
Trade names | 16,670 | (11,638 | ) | — | 5,032 | ||||||||||
Total | $ | 202,164 | $ | (106,247 | ) | $ | (1,025 | ) | $ | 94,892 | |||||
-48-
Future expected amortization of intangible assets is as follows for the years ending December 31, (in thousands):
Amortization | |||
2020 | $ | 18,809 | |
2021 | 18,446 | ||
2022 | 16,700 | ||
2023 | 12,700 | ||
2024 | 9,119 | ||
Thereafter | 56,401 | ||
Total | $ | 132,175 | |
(8) Debt
Long-term debt consisted of the following (in thousands):
December 31, | |||||||
2019 | 2018 | ||||||
Bank credit facility - term loan | $ | 120,800 | $ | 80,800 | |||
Bank credit facility - revolver loans | 152,000 | 81,934 | |||||
Principal amount of long-term debt | 272,800 | 162,734 | |||||
Less debt issuance costs | (2,789 | ) | (2,135 | ) | |||
Total long-term debt | 270,011 | 160,599 | |||||
Less current portion | (16,883 | ) | (9,466 | ) | |||
Long-term debt, net of current portion | $ | 253,128 | $ | 151,133 | |||
We have a loan agreement with a group of banks to provide working capital support, letters of credit and finance acquisitions. The loan agreement, which was amended in November 2019 and expires in January 2023, is comprised of a term loan facility and a revolving loan facility. The revolving loan facility provides for revolving loans and letters of credit. The fair value of outstanding debt under our bank loan facilities as of December 31, 2019 approximates its carrying value using Level 2 inputs based on market data on companies with a corporate rating similar to ours that have recently priced credit facilities.
Our required term loan payments after December 31, 2019 are as follows (in thousands):
Year ending December 31, | ||||
2020 | $ | 17,813 | ||
2021 | 21,562 | |||
2022 | 22,500 | |||
2023 | 58,925 | |||
Total | $ | 120,800 | ||
The maximum amount of credit available to us under the loan agreement for revolving loans and letters of credit as of December 31, 2019 was $350 million. We may borrow and repay the revolving loan borrowings as our cash flows require or permit. We pay an unused commitment fee and fees on letters of credit that are issued. We had approximately $54 thousand letters of credit outstanding as of December 31, 2019 and $57 thousand of letters of credit outstanding as of December 31, 2018.
Under the loan agreement we may elect to increase the maximum availability of the term loan facility, the revolving loan facility, or both facilities up to an aggregate additional amount of $100 million.
We pay interest on the term loan borrowings and revolving loan borrowings at LIBOR plus a base margin or at a base rate (typically the prime rate) plus a base margin. As of December 31, 2019, the LIBOR base margin was 2.50% and the base rate base margin was 1.25%. The base margins increase or decrease in increments as our Total Funded Debt/EBITDA Ratio increases or decreases.
-49-
The loan agreement requires us to have interest rate hedges on a portion of the outstanding term loan until February 6, 2021. We have executed compliant interest rate hedges. After taking into account the impact of hedging instruments, as of December 31, 2019, interest rates on portions of our outstanding debt ranged from 4.21% to 6.00%, and the effective interest rate on our aggregate outstanding debt was 4.77%.
Interest expense incurred on bank loan borrowings and interest rate hedges was approximately $13.3 million, $6.9 million and $7.2 million during the years ended December 31, 2019, 2018 and 2017, respectively.
The loan agreement contains collateral requirements to secure our loan agreement obligations, restrictive covenants, a limit on annual dividends, and other affirmative and negative covenants, conditions and limitations. Restrictive covenants include a maximum Total Funded Debt/EBITDA Ratio and a minimum Fixed Charge Coverage Ratio. We were in compliance with required ratios and other terms and conditions as of December 31, 2019.
(9) Accrued Expenses and Other Current Liabilities
Accrued expenses and other current liabilities consist primarily of accrued compensation and benefits of approximately $24.2 million and $24.6 million as of December 31, 2019 and 2018, respectively. The accrued compensation and benefits amounts include bonus, salaries and related payroll taxes, vacation and deferred compensation.
(10) Stock-Based Compensation Plans
In 2006, our stockholders approved the VSE Corporation 2006 Restricted Stock Plan for VSE's directors, officers and other employees (the "2006 Plan"). In May 2014, the stockholders approved amendments to the 2006 Plan extending its term until May 6, 2021 and authorizing an additional 500,000 shares of our common stock for issuance under the 2006 Plan. Under the 2006 Plan, we are authorized to issue up to 1,000,000 shares of our common stock and, as of December 31, 2019, 310,086 shares remained available for issuance under the 2006 Plan. The Compensation Committee is responsible for the administration of the 2006 Plan and determines each recipient of an award under the 2006 Plan, the number of restricted shares of common stock subject to such award and the period of continued employment required for the vesting of such award. These terms are included in award agreements between VSE and the recipients of the award.
During 2019, 2018 and 2017, non-employee directors were awarded 18,900, 11,200 and 16,100 shares of restricted stock, respectively, under the 2006 Plan. The weighted average grant-date fair value of these restricted stock grants was $31.58 per share, $49.38 per share, and $39.85 per share for the shares awarded in 2019, 2018 and 2017, respectively. The shares issued vested immediately and, without the Compensation Committee's approval, cannot be sold, transferred, pledged or assigned before the second anniversary of the grant date. Compensation expense related to these grants was approximately $597 thousand, $553 thousand and $642 thousand during 2019, 2018 and 2017, respectively.
In January of every year since 2007, we have notified certain employees that they are eligible to receive awards of VSE stock under our 2006 Plan, based on our financial performance for the respective fiscal years. These restricted stock awards vest ratably over three years and are expensed on an accelerated basis over the vesting period of approximately three years. Upon issuance of shares on each vesting date, the liability is reduced and additional paid-in capital is increased. The date of award determination is expected to be in March 2020 for the 2019 awards. The date of award determination for the 2018 awards and the 2017 awards was March 2, 2019 and March 1, 2018, respectively. On each vesting date, 100% of the vested award is paid in our shares. The number of shares issued is based on the fair market value of our common stock on the vesting date. On March 2, 2019, the employees eligible for the 2018 awards, 2017 awards and 2016 awards received a total of 44,839 shares of common stock. The grant-date fair value of these awards was $34.84 per share.
In April 2019, upon the resignation of our CEO, President and Chief Operating Officer, we awarded to him 20,348 shares of restricted VSE common stock under the 2006 Plan. The grant-date fair value of this award was $30.66 per share. We paid approximately $267 thousand to cover the personal tax liability related to this award. The shares issued vested immediately and cannot be sold, transferred, pledged or assigned before the second anniversary of the grant date. Compensation expense related to this award was approximately $736 thousand for the year ended December 31, 2019.
-50-
The total stock-based compensation expense related to restricted stock awards for the years ended December 31, are as follows (in thousands):
2019 | 2018 | 2017 | |||||||||
Employees | $ | 2,667 | $ | 2,332 | $ | 2,416 | |||||
Non-employee Directors | 597 | 553 | 642 | ||||||||
Total | $ | 3,264 | $ | 2,885 | $ | 3,058 | |||||
Employees are permitted to use a certain number of shares of restricted stock to cover their personal tax liability for restricted stock awards. We paid approximately $688 thousand, $641 thousand and $500 thousand, to cover this liability in the years ended December 31, 2019, 2018 and 2017, respectively. These payments are classified as financing cash flows on the consolidated statements of cash flows. The total compensation cost related to non-vested awards not yet recognized was approximately $873 thousand with a weighted average amortization period of 1.8 years and $1.5 million with a weighted average amortization period of 1.8 years as of December 31, 2019 and 2018, respectively.
Stock-based compensation consisting of restricted stock awards was included in costs and operating expenses and provision for income taxes on the accompanying statements of income for the years ended December 31, 2019, 2018 and 2017 (in thousands):
2019 | 2018 | 2017 | |||||||||
Stock-based compensation included in costs and operating expenses | $ | 3,264 | $ | 3,027 | $ | 3,068 | |||||
Income tax benefit recognized for stock-based compensation | (663 | ) | (755 | ) | (1,180 | ) | |||||
Stock-based compensation expense, net of income tax benefit | $ | 2,601 | $ | 2,272 | $ | 1,888 | |||||
(11) Income Taxes
We are subject to U.S. federal income tax as well as income tax in multiple state and local jurisdictions. We have concluded all U.S. federal income tax matters as well as material state and local tax matters for years through 2015.
The Tax Cuts and Jobs Act (the "Tax Act") was enacted on December 22, 2017. The Tax Act significantly affects the U.S. corporate income tax by, among other things, lowering the statutory corporate tax rate from 35% to 21%. In connection with the permanent reduction in the U.S. statutory corporate tax rate, we recalculated our net deferred tax liabilities as of December 31, 2017 and recorded a provisional tax benefit of approximately $10.6 million in 2017.
We applied the guidance in Staff Accounting Bulletin 118 when accounting for the enactment-date effects of the Tax Act in 2017 and throughout 2018. At December 31, 2017, we had substantially completed our provisional analysis of the income tax effects of the Tax Act and recorded a reasonable estimate in 2017 of such effects. During 2018, we refined our calculations, evaluated changes in interpretations and assumptions that we had made, applied additional guidance issued by the U.S. Government, and evaluated actions and related accounting policy decisions we have made. As of December 22, 2018, we completed our accounting for all of the enactment-date income tax effects of the Tax Act and identified an additional tax benefit of approximately $795 thousand to the provisional one-time charge for the year ended December 31, 2017, related to the Tax Act.
-51-
We file consolidated federal income tax returns that include all of our subsidiaries. The components of the provision for income taxes from continuing operations for the years ended December 31, 2019, 2018 and 2017 are as follows (in thousands):
2019 | 2018 | 2017 | |||||||||
Current | |||||||||||
Federal | $ | 7,739 | $ | 9,667 | $ | 14,149 | |||||
State | 1,344 | 1,758 | 2,511 | ||||||||
Foreign | 825 | 140 | — | ||||||||
9,908 | 11,565 | 16,660 | |||||||||
Deferred | |||||||||||
Federal | (66 | ) | (1,114 | ) | (10,645 | ) | |||||
State | (490 | ) | (347 | ) | 110 | ||||||
Foreign | 51 | 64 | (136 | ) | |||||||
(505 | ) | (1,397 | ) | (10,671 | ) | ||||||
Provision for income taxes | $ | 9,403 | $ | 10,168 | $ | 5,989 | |||||
The differences between the amount of tax computed at the federal statutory rate of 21% in 2019 and 2018, and 35% in 2017, and the provision for income taxes from continuing operations for the years ended December 31, 2019, 2018 and 2017 are as follows (in thousands):
2019 | 2018 | 2017 | |||||||||
Tax at statutory federal income tax rate | $ | 9,749 | $ | 9,502 | $ | 15,780 | |||||
Increases (decreases) in tax resulting from: | |||||||||||
State taxes, net of federal tax benefit | 1,805 | 1,861 | 1,732 | ||||||||
Permanent differences, net | (195 | ) | 367 | (275 | ) | ||||||
Impact of Tax Act | — | (795 | ) | (10,556 | ) | ||||||
Tax credits | (612 | ) | (375 | ) | (368 | ) | |||||
Prior year true-up adjustment | (1,274 | ) | (113 | ) | (346 | ) | |||||
Other provision adjustments | (70 | ) | (279 | ) | 22 | ||||||
Provision for income taxes | $ | 9,403 | $ | 10,168 | $ | 5,989 | |||||
Certain amounts from the prior years have been reclassified to conform to the current year presentation.
-52-
The tax effect of temporary differences representing deferred tax assets and liabilities as of December 31, 2019 and 2018 are as follows (in thousands):
2019 | 2018 | ||||||
Gross deferred tax assets | |||||||
Deferred compensation and accrued paid leave | $ | 7,498 | $ | 5,794 | |||
Accrued expenses | 303 | 1,310 | |||||
Stock-based compensation | 678 | 819 | |||||
Interest rate swaps | 367 | — | |||||
Reserve for contract disallowances | 145 | 120 | |||||
Acquisition-related expenses | — | 151 | |||||
Capitalized inventory | — | 742 | |||||
State operating loss carryforward | 24 | 24 | |||||
Tax credit carryforward | 1,547 | 47 | |||||
Foreign country operating loss carryforward | — | 157 | |||||
10,562 | 9,164 | ||||||
Valuation allowance (a) | (1,165 | ) | (107 | ) | |||
Total gross deferred tax assets | 9,397 | 9,057 | |||||
Gross deferred tax liabilities | |||||||
Interest rate swaps | — | (49 | ) | ||||
Depreciation | (1,877 | ) | (1,739 | ) | |||
Deferred revenues | (1,681 | ) | (2,164 | ) | |||
Goodwill and intangible assets | (23,383 | ) | (23,395 | ) | |||
Prepaid expenses | (60 | ) | (120 | ) | |||
Capitalized inventory | (240 | ) | — | ||||
Total gross deferred tax liabilities | (27,241 | ) | (27,467 | ) | |||
Net deferred tax liabilities | $ | (17,844 | ) | $ | (18,410 | ) | |
(a) A valuation allowance was provided against certain state tax credit and foreign tax loss deferred tax assets arising from carryforwards of unused tax benefits.
(12) Commitments and Contingencies
(a) Leases and Other Commitments
We adopted a comprehensive new lease accounting standard effective January 1, 2019 using optional modified retrospective transition method; accordingly, the comparative information as of December 31, 2018 and for the years ended December 31, 2018 and 2017 have not been adjusted and continue to be reported under the previous lease standard. See “Recently Adopted Accounting Pronouncements” in Note 1 for details of the significant changes to our accounting policies resulting from the adoption of the new accounting standard.
We determine at inception whether an arrangement that provides us control over the use of an asset is a lease. We recognize at lease commencement a right-of-use ("ROU") asset and lease liability based on the present value of the future lease payments over the lease term. Substantially all of our leases are long-term operating leases for facilities with fixed payment terms between two and 15 years. Our operating lease ROU assets are recorded in operating lease right-of-use assets on our accompanying consolidated balance sheet. The current portion of operating lease liabilities are presented within accrued expenses and other current liabilities, and the non-current portion of operating lease liabilities are presented under long-term operating lease liabilities on our accompanying consolidated balance sheet.
For leases with terms greater than 12 months, we record the related asset and lease liability at the present value of lease payments over the lease term. Leases with an initial term of 12 months or less with purchase options or extension options that are not reasonably certain to be exercised are not recorded on the balance sheet. We recognize lease expense for these leases on a straight-line basis over the term of the lease.
Our lease cost for the year ended December 31, 2019 included the following components (in thousands):
-53-
Year ended | ||||||
December 31, 2019 | ||||||
Operating lease cost | $ | 6,106 | ||||
Short-term lease cost | 698 | |||||
Less: sublease income | (1,022 | ) | ||||
Total lease cost, net | $ | 5,782 | ||||
For the years ended December 31, 2018 and 2017, total lease expense on our operating leases under the previous lease standard, net of sublease rentals, were $2.2 million and $3.8 million, respectively.
Certain of our leases include options to extend the term of the lease or to terminate the lease. When it is reasonably certain that we will exercise the option, we include the impact of the option in the lease term for purposes of determining total future lease payments. Our lease agreements do not provide a readily determinable implicit rate nor is it available to us from our lessors. Instead, we estimate our incremental borrowing rate based on information available at lease commencement to discount lease payments to present value.
The table below summarizes future minimum lease payments under operating leases, recorded on the balance sheet, as of December 31, 2019 (in thousands):
Operating Leases | ||||
2020 | $ | 5,468 | ||
2021 | 5,210 | |||
2022 | 5,180 | |||
2023 | 4,758 | |||
2024 | 4,333 | |||
After 2024 | 9,433 | |||
Minimum lease payments | 34,382 | |||
Less: imputed interest | (6,231 | ) | ||
Present value of minimum lease payments | 28,151 | |||
Less: current maturities of lease liabilities | (3,710 | ) | ||
Long-term lease liabilities | $ | 24,441 | ||
We made cash payments of approximately $5.7 million for operating leases during the year ended December 31, 2019, which are included in cash flows from operating activities in our consolidated statement of cash flows. The weighted average remaining lease term and discount rate for our operating leases were approximately 6.6 years and 6.0%, respectively at December 31, 2019.
(b) Contingencies
As previously reported, on or about April 19, 2018 Joseph Waggoner, on behalf of himself and all similarly situated individuals, filed a lawsuit against VSE and two of our subcontractors in the United State District Court, Eastern District of Texas, Texarkana Division, alleging overtime compensation entitlement at a rate of one and one-half times their regular rate of pay for all hours worked over 40 hours in a workweek. The plaintiffs worked under VSE’s contract with the United States Army at the Red River Army Depot in Texas. On January 14, 2020, the parties settled the lawsuit. While the settlement amount VSE agreed to pay the defendants was in excess of the amount that VSE had previously accrued as a loss provision in respect of the lawsuit, the difference was not material.
In addition to the above-referenced legal proceeding, we may have certain claims in the normal course of business, including legal proceedings, against us and against other parties. In our opinion, the resolution of these other claims will not have a material adverse effect on our results of operations, financial position or cash flows. However, because the results of any legal proceedings cannot be predicted with certainty, the amount of loss, if any, cannot be reasonably estimated.
Further, from time-to-time, government agencies investigate whether our operations are being conducted in accordance with applicable contractual and regulatory requirements. Government investigations of us, whether relating to government contracts or conducted for other reasons, could result in administrative, civil or criminal liabilities, including repayments, fines or penalties
-54-
being imposed upon us, or could lead to suspension or debarment from future government contracting. Government investigations often take years to complete and most result in no adverse action against us. We believe, based upon current information, that the outcome of any such government disputes and investigations will not have a material adverse effect on our results of operations, financial condition or cash flows.
(13) Business Segments and Customer Information
Segment Information
Management of our business operations is conducted under three reportable operating segments:
Aviation Group – Our Aviation Group provides international parts supply and distribution, supply chain solutions, component and engine accessory repair services supporting global aftermarket commercial and business and general aviation customers through product distribution and MRO services.
Supply Chain Management Group – Our Supply Chain Management Group provides parts supply, inventory management, e-commerce fulfillment, logistics, data management, and other services to assist aftermarket United States Postal Service ("USPS"), DoD and aftermarket commercial high duty-cycle truck and fleet customers.
Federal Services Group – Our Federal Services Group provides aftermarket refurbishment and sustainment services to extend and maintain the life cycle of military vehicles, ships, and aircraft for the DoD. The group provides foreign military sales services, engineering, logistics, maintenance, configuration management, prototyping, technology, and field support services to the DoD and other customers. We also provide energy consulting services and healthcare IT and IT data solutions.
The operating segments reported below are the segments of the Company for which separate financial information is available and for which segment results are evaluated regularly by our Chief Executive Officer in deciding how to allocate resources and in assessing performance. We evaluate segment performance based on consolidated revenues and operating income. Net sales of our business segments exclude intersegment sales as these activities are eliminated in consolidation.
-55-
Our segment information is as follows (in thousands):
For the years ended December 31, | |||||||||||
2019 | 2018 | 2017 | |||||||||
Revenues | |||||||||||
Aviation Group | $ | 224,546 | $ | 145,423 | $ | 134,809 | |||||
Supply Chain Management Group | 214,520 | 214,809 | 214,542 | ||||||||
Federal Services Group | 313,561 | 336,986 | 410,762 | ||||||||
Total revenues | $ | 752,627 | $ | 697,218 | $ | 760,113 | |||||
Operating income: | |||||||||||
Aviation Group | $ | 17,901 | $ | 11,076 | $ | 9,695 | |||||
Supply Chain Management Group | 29,819 | 30,626 | 33,754 | ||||||||
Federal Services Group | 18,144 | 15,797 | 13,419 | ||||||||
Corporate expenses | (5,607 | ) | (3,269 | ) | (2,543 | ) | |||||
Operating income | $ | 60,257 | $ | 54,230 | $ | 54,325 | |||||
Depreciation and amortization expense: | |||||||||||
Aviation Group | $ | 12,546 | $ | 5,123 | $ | 4,835 | |||||
Supply Chain Management Group | 11,085 | 7,299 | 6,536 | ||||||||
Federal Services Group | 3,296 | 12,802 | 14,511 | ||||||||
Total depreciation and amortization | $ | 26,927 | $ | 25,224 | $ | 25,882 | |||||
Capital expenditures: | |||||||||||
Aviation Group | $ | 8,396 | $ | 1,772 | $ | 1,387 | |||||
Supply Chain Management Group | 1,076 | 802 | 1,376 | ||||||||
Federal Services Group | 58 | 209 | 177 | ||||||||
Corporate | 130 | 334 | 373 | ||||||||
Total capital expenditures | $ | 9,660 | $ | 3,117 | $ | 3,313 | |||||
December 31, | |||||||
2019 | 2018 | ||||||
Total assets: | |||||||
Aviation Group | $ | 522,446 | $ | 316,197 | |||
Supply Chain Management Group | 170,142 | 166,015 | |||||
Federal Services Group | 88,966 | 92,098 | |||||
Corporate | 64,310 | 64,518 | |||||
Total assets | $ | 845,864 | $ | 638,828 | |||
Revenues are net of inter-segment eliminations. Corporate expenses are primarily selling, general and administrative expenses not allocated to segments. In the third quarter of 2018, we completed the sale of a contract we had been awarded by the National Institutes of Health, which resulted in a $1.7 million gain recorded within our Federal Services Group. Corporate assets are primarily cash, property and equipment and investments held in separate trust.
In 2019, we allocated depreciation and amortization expense to each segment based on the segment in which each asset was utilized. In 2018 and 2017, the allocation method for certain amortization expenses was based on each segment’s percentage of overall cost. The primary reason for the change is to allocate depreciation and amortization expense to a specific segment depending on the asset deployment. Depreciation and amortization expense by segment for 2018 and 2017 was not recast for these allocation changes, and this change did not impact our previously reported consolidated financial results. The impact for 2018, under the new allocation method, would have been a decrease in depreciation and amortization expense for the Federal Services Group of $8.1 million, with a corresponding increase for Aviation Group and Supply Chain Group of $3.7 million and $4.4 million, respectively. The impact for 2017 would have been a decrease in depreciation and amortization expense for the Federal Services Group of $9.1 million, with a corresponding increase for Aviation Group and Supply Chain Group of $4.1 million and $5.0 million, respectively.
-56-
Customer Information
Our revenues are derived from contract services performed for DoD agencies or federal civilian agencies and from the delivery of products to our commercial clients. The USPS, U.S. Army and Army Reserve, and U.S. Navy are our largest customers. Our customers also include various other government agencies and commercial entities. Our revenue by customer is as follows for the years ended December 31, (in thousands):
(in thousands) Years ended December 31, | ||||||||||||||||||
Source of Revenues | 2019 | % | 2018 | % | 2017 | % | ||||||||||||
DoD | $ | 304,334 | 41 | $ | 334,494 | 48 | $ | 402,229 | 53 | |||||||||
Other government | 205,775 | 27 | 212,118 | 30 | 218,426 | 29 | ||||||||||||
Commercial | 242,518 | 32 | 150,606 | 22 | 139,458 | 18 | ||||||||||||
Total Revenues | $ | 752,627 | 100 | $ | 697,218 | 100 | $ | 760,113 | 100 | |||||||||
We do not measure revenue or profit by product or service lines, either for internal management or external financial reporting purposes, because it would be impractical to do so. Products offered and services performed are determined by contract requirements and the types of products and services provided for one contract bear no relation to similar products and services provided on another contract. Products and services provided vary when new contracts begin or current contracts expire. In many cases, more than one product or service is provided under a contract or contract task order. Accordingly, cost and revenue tracking are designed to best serve contract requirements and segregating costs and revenues by product or service lines in situations for which it is not required would be difficult and costly to both us and our customers.
Geographical Information
Revenue by geography is based on the billing address of the customer. Our revenue by geographic area is as follows (in thousands):
Years ended December 31, | ||||||||||||
2019 | 2018 | 2017 | ||||||||||
United States | $ | 659,451 | $ | 647,168 | $ | 708,474 | ||||||
Other Countries (1) | 93,176 | 50,050 | 51,639 | |||||||||
Total revenue | $ | 752,627 | $ | 697,218 | $ | 760,113 | ||||||
(1) No individual country, other than disclosed above, exceeded 10% of our total revenue for any period presented.
(14) Capital Stock
Common Stock
Our common stock has a par value of $0.05 per share. Proceeds from common stock issuances that are greater than $0.05 per share are credited to additional paid in capital. Holders of common stock are entitled to one vote per common share held on all matters voted on by our stockholders. Stockholders of record are entitled to the amount of dividends declared per common share held.
(15) 401(k) Plan
We maintain a defined contribution plan under Section 401(k) of the Internal Revenue Code of 1986, as amended, that covers substantially all of our employees. Under the provisions of our 401(k) plan, employees' eligible contributions are matched at rates specified in the plan documents. Our expense associated with this plan was approximately $5.5 million, $5.9 million and $6.2 million for the years ended December 31, 2019, 2018, and 2017, respectively.
(16) Fair Value Measurements
The accounting standard for fair value measurements defines fair value and establishes a market-based framework or hierarchy for measuring fair value. The standard is applicable whenever assets and liabilities are measured at fair value.
The fair value hierarchy established in the standard prioritizes the inputs used in valuation techniques into three levels as follows:
Level 1 – Observable inputs – quoted prices in active markets for identical assets and liabilities;
-57-
Level 2 – Observable inputs other than the quoted prices in active markets for identical assets and liabilities – includes quoted prices for similar instruments, quoted prices for identical or similar instruments in inactive markets, and amounts derived from valuation models where all significant inputs are observable in active markets; and
Level 3 – Unobservable inputs – includes amounts derived from valuation models where one or more significant inputs are unobservable and require us to develop relevant assumptions.
The following table summarizes the financial assets and liabilities measured at fair value on a recurring basis as of December 31, 2019 and December 31, 2018 and the level they fall within the fair value hierarchy (in thousands):
Amounts Recorded at Fair Value | Financial Statement Classification | Fair Value Hierarchy | Fair Value December 31, 2019 | Fair Value December 31, 2018 | ||||||||
Non-COLI assets held in Deferred Supplemental Compensation Plan | Other assets | 1 | $ | 710 | $ | 403 | ||||||
Interest rate swaps | Accrued expenses/Other current assets | 2 | $ | 1,473 | $ | 195 | ||||||
Earn-out obligation-current | Current portion of earn-out obligation | 3 | $ | 31,700 | $ | — | ||||||
Earn-out obligation-long-term | Earn-out obligation | 3 | $ | 5,000 | $ | — | ||||||
Non-COLI assets held in the deferred supplemental compensation plan consist of equity funds with fair value based on observable inputs such as quoted prices for identical assets in active markets and changes in its fair value are recorded as selling, general and administrative expenses.
We account for our interest rate swap agreements under the provisions of ASC 815, Derivatives and Hedging, and have determined that our swap agreements qualify as cash flow hedges. Accordingly, the fair value of the swap agreements, which is an asset recorded in other current assets of approximately $1.5 million and approximately $195 thousand at December 31, 2019 and 2018, respectively. The offset, net of an income tax effect of approximately $367 thousand and $49 thousand is included in accumulated other comprehensive income in the accompanying balance sheets as of December 31, 2019 and 2018, respectively. The amounts paid and received on the swap agreements are recorded in interest expense in the period during which the related floating-rate interest is incurred. We determine the fair value of the swap agreements based on a valuation model using market data inputs.
We utilized an income approach to determine the fair value of our 1st Choice Aerospace acquisition earn-out obligation. Significant unobservable inputs used to value the contingent consideration include projected revenue and cost of services and the discount rate. If a significant increase or decrease in the discount rate occurred in isolation, the result could be significantly higher or lower fair value measurement. In January 2020, after obtaining the sellers' consent to our proposed amount of the earn-out payment for the 2019 performance year, we made a payment of approximately $31.7 million to satisfy the 2019 performance year obligation.
The fair value of the earn-out obligation increased by $1.9 million during the fourth quarter of 2019.
-58-
(17) Selected Quarterly Data (Unaudited)
The following table shows selected quarterly data for 2019 and 2018, in thousands, except earnings per share.
2019 Quarters | |||||||||||||||
1st | 2nd | 3rd | 4th | ||||||||||||
Revenues | $ | 169,919 | $ | 189,111 | $ | 198,326 | $ | 195,271 | |||||||
Costs and operating expenses | $ | 158,106 | $ | 172,695 | $ | 181,111 | $ | 180,458 | |||||||
Operating income | $ | 11,813 | $ | 16,416 | $ | 17,215 | $ | 14,813 | |||||||
Net income | $ | 6,603 | $ | 9,898 | $ | 10,527 | $ | 9,996 | |||||||
Basic earnings per share: | |||||||||||||||
Net income | $ | 0.60 | $ | 0.90 | $ | 0.96 | $ | 0.92 | |||||||
Basic weighted average shares outstanding | 10,920 | 10,970 | 10,970 | 10,882 | |||||||||||
Diluted earnings per share: | |||||||||||||||
Net income | $ | 0.60 | $ | 0.89 | $ | 0.95 | $ | 0.90 | |||||||
Diluted weighted average shares outstanding | 10,974 | 11,073 | 11,060 | 11,071 | |||||||||||
2018 Quarters | |||||||||||||||
1st | 2nd | 3rd | 4th | ||||||||||||
Revenues | $ | 176,897 | $ | 170,394 | $ | 168,931 | $ | 180,996 | |||||||
Costs and operating expenses | $ | 165,304 | $ | 156,539 | $ | 154,934 | $ | 167,911 | |||||||
Operating income | $ | 11,593 | $ | 13,855 | $ | 15,697 | $ | 13,085 | |||||||
Net income (1) | $ | 7,052 | $ | 8,751 | $ | 10,034 | $ | 9,243 | |||||||
Basic earnings per share: | |||||||||||||||
Net income (1) | $ | 0.65 | $ | 0.80 | $ | 0.92 | $ | 0.85 | |||||||
Basic weighted average shares outstanding | 10,861 | 10,881 | 10,881 | 10,882 | |||||||||||
Diluted earnings per share: | |||||||||||||||
Net income | $ | 0.65 | $ | 0.80 | $ | 0.92 | $ | 0.84 | |||||||
Diluted weighted average shares outstanding | 10,897 | 10,919 | 10,935 | 10,991 | |||||||||||
(1) Operating income for the third quarter of 2018 includes a $1.7 million gain from the sale of a contract.
(18) Subsequent Events
On January 28, 2020 VSE’s subsidiary VSE Aviation, Inc entered into a definitive agreement to sell Prime Turbines LLC (Prime Turbines) to PTB Holdings USA, LLC for a sale price of $21 million. The transaction was completed on February 26, 2020. Prime Turbines is a provider of turboprop aircraft engine repair, maintenance and overhaul, including for Pratt & Whitney Canada PT6A and PT6T series engines and is included in our Aviation Group segment. VSE estimates that it will incur a non-cash loss ranging from $6 million to $7.5 million in respect of the sale of Prime Turbines. Prime Turbines did not meet the held for sale criteria per ASC 360 at December 31, 2019, and as such, Prime Turbines assets and liabilities as of December 31, 2019, and results of operations for all periods presented are classified as held and used in the consolidated financial statements.
ITEM 9. Changes in and Disagreements with Accountants on Accounting and Financial Disclosure
None.
ITEM 9A. Controls and Procedures
Evaluation of Disclosure Controls and Procedures
-59-
Our management has evaluated, with the participation of our Chief Executive Officer and Chief Financial Officer, the effectiveness of our disclosure controls and procedures (as defined in Rules 13a-15(e) and 15(d)-15(e) under the Securities Exchange Act. Based on this evaluation, our Chief Executive Officer and Chief Financial Officer have concluded that, as of such date, our disclosure controls and procedures were effective to ensure that information we are required to disclose in reports that we file or submit under the Exchange Act is recorded, processed, summarized and reported within the time periods specified in SEC rules and forms and that such information is accumulated and communicated to our management, including our Chief Executive Officer and Chief Financial Officer, as appropriate, to allow timely decisions regarding required disclosure.
Management's Report on Internal Control Over Financial Reporting
Management is responsible for establishing and maintaining adequate internal control over financial reporting, as such term is defined in Exchange Act Rules 13a-15(f) and 15d-15(f). Under the supervision and with the participation of our management, including our Chief Executive Officer and Chief Financial Officer, we conducted an assessment of the effectiveness of our internal control over financial reporting as of December 31, 2019 based on the framework in Internal Control – Integrated Framework issued by the Committee of Sponsoring Organizations of the Treadway Commission (2013 Framework). Based on our assessment under the framework in Internal Control – Integrated Framework, our management concluded that our internal control over financial reporting was effective as of December 31, 2019. Grant Thornton LLP, our independent registered public accounting firm, has issued an opinion on our internal control over financial reporting. This opinion appears in the Report of Independent Registered Public Accounting Firm set forth below.
As is consistent with interpretive guidance provided by the SEC's staff, management has elected to exclude 1st Choice Aerospace, acquired in January 2019, from its assessment and conclusion of the effectiveness of the Company's internal control over financial reporting as of December 31, 2019. The assets and revenues of 1st Choice Aerospace constituted 4.3% and 8.4% of the Company's consolidated total assets and total revenues as of and for the year ended December 31, 2019, respectively.
Change in Internal Controls
During the fourth quarter of fiscal year 2019, there were no changes in our internal control over financial reporting, as defined in Rules 13a-15(f) and 15d-15(f) under the Exchange Act) that have materially affected these controls, or are reasonably likely to materially affect these controls subsequent to the evaluation of these controls.
-60-
Report of Independent Registered Public Accounting Firm
Board of Directors and Stockholders
VSE Corporation
Opinion on internal control over financial reporting
We have audited the internal control over financial reporting of VSE Corporation (a Delaware corporation) and subsidiaries (the “Company”) as of December 31, 2019, based on criteria established in the 2013 Internal Control-Integrated Framework issued by the Committee of Sponsoring Organizations of the Treadway Commission (“COSO”). In our opinion, the Company maintained, in all material respects, effective internal control over financial reporting as of December 31, 2019, based on criteria established in the 2013 Internal Control-Integrated Framework issued by COSO.
We also have audited, in accordance with the standards of the Public Company Accounting Oversight Board (United States) (“PCAOB”), the consolidated financial statements of the Company as of and for the year ended December 31, 2019, and our report dated March 9, 2020 expressed an unqualified opinion on those consolidated financial statements.
Basis for opinion
The Company’s management is responsible for maintaining effective internal control over financial reporting and for its assessment of the effectiveness of internal control over financial reporting, included in the accompanying Management’s Report on Internal Control Over Financial Reporting (“Management’s Report”). Our responsibility is to express an opinion on the Company’s internal control over financial reporting based on our audit. We are a public accounting firm registered with the PCAOB and are required to be independent with respect to the Company in accordance with the U.S. federal securities laws and the applicable rules and regulations of the Securities and Exchange Commission and the PCAOB.
We conducted our audit in accordance with the standards of the PCAOB. Those standards require that we plan and perform the audit to obtain reasonable assurance about whether effective internal control over financial reporting was maintained in all material respects. Our audit included obtaining an understanding of internal control over financial reporting, assessing the risk that a material weakness exists, testing and evaluating the design and operating effectiveness of internal control based on the assessed risk, and performing such other procedures as we considered necessary in the circumstances. We believe that our audit provides a reasonable basis for our opinion.
Our audit of, and opinion on, the Company’s internal control over financial reporting does not include the internal control over financial reporting of 1st Choice Aerospace, Inc., a wholly-owned subsidiary, whose financial statements reflect total assets and revenues constituting 4.3 and 8.4 percent, respectively, of the related consolidated financial statement amounts as of and for the year ended December 31, 2019. As indicated in Management’s Report, 1st Choice Aerospace, Inc. was acquired during 2019. Management’s assertion on the effectiveness of the Company’s internal control over financial reporting excluded internal control over financial reporting of 1st Choice Aerospace, Inc.
Definition and limitations of internal control over financial reporting
A company’s internal control over financial reporting is a process designed to provide reasonable assurance regarding the reliability of financial reporting and the preparation of financial statements for external purposes in accordance with generally accepted accounting principles. A company’s internal control over financial reporting includes those policies and procedures that (1) pertain to the maintenance of records that, in reasonable detail, accurately and fairly reflect the transactions and dispositions of the assets of the company; (2) provide reasonable assurance that transactions are recorded as necessary to permit preparation of financial statements in accordance with generally accepted accounting principles, and that receipts and expenditures of the company are being made only in accordance with authorizations of management and directors of the company; and (3) provide reasonable assurance regarding prevention or timely detection of unauthorized acquisition, use, or disposition of the company’s assets that could have a material effect on the financial statements.
Because of its inherent limitations, internal control over financial reporting may not prevent or detect misstatements. Also, projections of any evaluation of effectiveness to future periods are subject to the risk that controls may become inadequate because of changes in conditions, or that the degree of compliance with the policies or procedures may deteriorate.
/s/ GRANT THORNTON LLP
Arlington, Virginia | |
March 9, 2020 | |
-61-
ITEM 9B. Other Information
None.
PART III
Except as otherwise indicated below, the information required by Items 10, 11, 12, 13 and 14 of Part III of Form 10-K has been omitted in reliance of General Instruction G(3) to Form 10-K and is incorporated herein by reference to our definitive proxy statement to be filed with the SEC not later than 120 days after December 31, 2019 in respect of the Annual Meeting of VSE's stockholders scheduled to be held on May 6, 2020 (the "Proxy Statement").
ITEM 10. Directors, Executive Officers and Corporate Governance
Information called on by Item 10 will be set forth in our Proxy Statement, which information is incorporated herein by reference.
ITEM 11. Executive Compensation
Information called on by Item 11 will be set forth in our Proxy Statement, which information is incorporated herein by reference.
ITEM 12. Security Ownership of Certain Beneficial Owners and Management and Related Stockholder Matters
Except for the "Equity Compensation Plan Information" disclosed in Item 5(e) above, the information called on by this Item 12 will be set forth in our Proxy Statement, which information is incorporated herein by reference.
ITEM 13. Certain Relationships and Related Transactions, and Director Independence
Information called on by Item 13 will be set forth in our Proxy Statement, which information is incorporated herein by reference.
ITEM 14. Principal Accountant Fees and Services
Information called on by Item 14 will be set forth in our Proxy Statement, which information is incorporated herein by reference.
PART IV
ITEM 15. Exhibits and Financial Statement Schedules
1.Financial Statements
The consolidated financial statements are listed under Item 8 of this Form 10-K.
2.Supplemental Financial Statement Schedules
All schedules have been omitted because they are not applicable, not required, or the information has been otherwise supplied in the financial statements or notes to the financial statements.
3.Exhibits
See "Exhibit Index" hereinafter contained and incorporated by reference.
-62-
ITEM 16. Form 10-K Summary
None.
-63-
EXHIBIT INDEX | ||
Reference No. Per Item 601 of Regulation S-K | Description of Exhibit | Exhibit No. In this Form 10-K |
3.1 | * | |
3.2 | * | |
4.1 | Specimen Stock Certificate as of May 19, 1983 (Exhibit 4 to Registration Statement No. 2-83255 dated April 22, 1983 on Form S-2) | * + P |
4.2 | Exhibit 4.2 | |
10.1 | Material contracts | |
10.2 | * + | |
10.3 | * + | |
10.4 | Amended and Restated Employment Agreement dated as of December 6, 2013 by and between VSE Corporation and Maurice A. Gauthier (Exhibit 10.3 to Form 10-Q dated April 29, 2016); Amendment Agreement dated as of December 14, 2016 by and between VSE Corporation and Maurice A. Gauthier (Exhibit 10.1 to Form 8-K dated December 16, 2016; and an Amendment Agreement dated as of March 1, 2019 by and between VSE Corporation and Maurice A. Gauthier (Exhibit 10.3 to Form 10-K dated March 6, 2019) | * + |
10.5 | * + | |
10.6 | * + | |
10.7 | * | |
10.8 | * | |
10.9 | * | |
10.1 | * + | |
-64-
10.11 | * + | |
21.1 | Exhibit 21 | |
23.1 | Exhibit 23.1 | |
23.2 | Exhibit 23.2 | |
31.1 | Exhibit 31.1 | |
31.2 | Exhibit 31.2 | |
32.1 | Exhibit 32.1 | |
32.2 | Exhibit 32.2 | |
99.1 | * | |
101.INS | XBRL Instance Document | |
101.SCH | XBRL Taxonomy Extension Schema Document | |
101.CAL | XBRL Taxonomy Extension Calculation Linkbase Document | |
101.DEF | XBRL Taxonomy Extension Definition Linkbase Document | |
101.LAB | XBRL Taxonomy Extension Label Linkbase Document | |
101.PRE | XBRL Taxonomy Extension Presentation Linkbase Document | |
* Document has been filed as indicated and is incorporated by reference herein.
+ Indicates management contract or compensatory plan or arrangement.
P Indicates exhibit was submitted to the Securities and Exchange Commission as a paper filing prior to the time that electronic filing on EDGAR became mandatory.
-65-
SIGNATURES
Pursuant to the requirements of Section 13 or 15(d) of the Securities Exchange Act of 1934, Registrant has duly caused this report to be signed on its behalf by the undersigned, thereunto duly authorized.
VSE CORPORATION | |||
Date: | March 9, 2020 | By: | /s/ John A. Cuomo |
John A. Cuomo | |||
Chief Executive Officer and President | |||
Pursuant to the requirements of the Securities Exchange Act of 1934, this report has been signed by the following persons on behalf of Registrant and in the capacities and on the dates indicated.
Name | Title | Date |
/s/ John A. Cuomo | Director, Chief Executive | March 9, 2020 |
John A. Cuomo | Officer and President | |
/s/ Thomas R. Loftus | Executive Vice President | March 9, 2020 |
Thomas R. Loftus | and Chief Financial Officer | |
(Principal Accounting Officer) | ||
/s/ Ralph E. Eberhart | Chairman/Director | March 9, 2020 |
Ralph E. Eberhart | ||
/s/ Calvin S. Koonce | Director | March 9, 2020 |
Calvin S. Koonce | ||
/s/ James F. Lafond | Director | March 9, 2020 |
James F. Lafond | ||
/s/ Bonnie K. Wachtel | Director | March 9, 2020 |
Bonnie K. Wachtel | ||
/s/ Jack C. Stultz | Director | March 9, 2020 |
Jack C. Stultz | ||
/s/ John E. Potter | Director | March 9, 2020 |
John E. Potter | ||
/s/ Mark E. Ferguson III | Director | March 9, 2020 |
Mark E. Ferguson III | ||
-66-