UNITED STATES
SECURITIES AND EXCHANGE COMMISSION
Washington, D.C. 20549
FORM 10-K
ANNUAL REPORT PURSUANT TO SECTION 13 OR 15(d)
OF THE SECURITIES EXCHANGE ACT OF 1934
For the Fiscal Year Ended December 31, 2018 Commission File Number: 0‑3676
VSE CORPORATION
(Exact Name of Registrant as Specified in its Charter)
|
| |
DELAWARE | 54-0649263 |
(State or Other Jurisdiction of Incorporation or Organization) | (I.R.S. Employer Identification No.) |
|
| | | | |
6348 Walker Lane | | | | |
Alexandria, Virginia | | 22310 | | www.vsecorp.com |
(Address of Principal Executive Offices) | | (Zip Code) | | (Webpage) |
Registrant's Telephone Number, Including Area Code: (703) 960-4600
Securities registered pursuant to Section 12(b) of the Act:
|
| |
Title of each class | Name of each exchange on which registered |
Common Stock, par value $.05 per share | The NASDAQ Global Select Market |
Securities registered pursuant to Section 12(g) of the Act: None
Indicate by check mark if the registrant is a well-known seasoned issuer, as defined in Rule 405 of the Securities Act. Yes [ ] No
[x]
Indicate by check mark if the registrant is not required to file reports pursuant to Section 13 or Section 15(d) of the Act. Yes [ ] No [x]
Indicate by check mark whether the registrant (1) has filed all reports required to be filed by Section 13 or 15(d) of the Securities Exchange Act of 1934 during the preceding 12 months (or for such shorter period that the registrant was required to file such reports), and (2) has been subject to such filing requirements for the past 90 days. Yes [x] No [ ]
Indicate by check mark whether the registrant has submitted electronically and posted on its corporate Web site, if any, every Interactive Data File required to be submitted and posted pursuant to Rule 405 of Regulation S-T (section 232.405 of this chapter) during the preceding 12 months (or for such shorter period that the registrant was required to submit and post such files).
Yes [x] No [ ]
Indicate by check mark if disclosure of delinquent filers pursuant to Item 405 of Regulation S-K is not contained herein, and will not be contained, to the best of registrant's knowledge, in definitive proxy or information statements incorporated by reference in Part III of this Form 10-K or any amendment to this Form 10-K. [ ]
Indicate by check mark whether the registrant is a large accelerated filer, an accelerated filer, a non-accelerated filer, or a smaller reporting company. See definition of "large accelerated filer," "accelerated filer" and "smaller reporting company" in Rule 12b-2 of the Exchange Act.
Large accelerated filer [ ] Accelerated filer [x] Non-accelerated filer [ ] Smaller reporting company [ ]
If an emerging growth company, indicate by check mark if the registrant has elected not to use the extended transaction period for complying with any new or revised financial accounting standards provided pursuant to Section 13(a) of the Exchange Act. Yes [ ] No [ ]
Indicate by check mark whether the registrant is a shell company (as defined in Rule 12b-2 of the Act). Yes [ ] No [x]
The aggregate market value of outstanding voting stock held by non-affiliates of the Registrant as of June 30, 2018, was approximately $412 million based on the last reported sales price of the registrant's common stock on The NASDAQ Global Select Market as of that date.
Number of shares of Common Stock outstanding as of February 26, 2019: 10,904,936.
DOCUMENTS INCORPORATED BY REFERENCE
Portions of Registrant's definitive proxy statement for the Annual Meeting of Stockholders expected to be held on May 7, 2019, are incorporated herein by reference into Part III of this report.
|
| | |
TABLE OF CONTENTS |
| | Page |
| | |
| | |
ITEM 1 | | |
ITEM 1A | | |
ITEM 1B | | |
ITEM 2 | | |
ITEM 3 | | |
ITEM 4 | | |
ITEM 4(a) | | |
| | |
| | |
| | |
ITEM 5 | | |
ITEM 6 | | |
ITEM 7 | | |
ITEM 7A | | |
ITEM 8 | | |
ITEM 9 | | |
ITEM 9A | | |
ITEM 9B | | |
| | |
| | |
| | |
ITEM 10 | | |
ITEM 11 | | |
ITEM 12 | | |
ITEM 13 | | |
ITEM 14 | | |
| | |
| | |
| | |
ITEM 15 | | |
| | |
| | |
| | |
| | |
| | |
| | |
Forward Looking Statements
This Annual Report on Form 10-K ("Form 10-K") contains statements that, to the extent they are not recitations of historical fact, constitute "forward looking statements" under federal securities laws. All such statements are intended to be subject to the safe harbor protection provided by applicable securities laws. For discussions identifying some important factors that could cause actual VSE Corporation ("VSE," the "Company," "us," "our," or "we") results to differ materially from those anticipated in the forward looking statements contained in this filing, see below VSE's "Narrative Description of Business" (Items 1, 1A, 2 and 3), and Item 7 "Management's Discussion and Analysis of Financial Condition and Results of Operations." Readers are cautioned not to place undue reliance on these forward looking statements, which reflect management's analysis only as of the date hereof. The Company undertakes no obligation to publicly revise these forward looking statements to reflect events or circumstances that occur or arise after the date hereof. Readers should also carefully review the risk factors described in other documents the Company files from time to time with the Securities and Exchange Commission, including Quarterly Reports on Form 10-Q filed by the Company subsequent to this Form 10-K and any Current Reports on Form 8-K filed by the Company.
PART I
ITEM 1. Business
(a) General Background
We are a diversified services and supply chain management company that assists our clients in sustaining, extending the service life, and improving the performance of their transportation equipment and other assets and systems. We provide logistics and distribution services for legacy systems and equipment and professional and technical services to the United States Government (the "government"), including the United States Department of Defense ("DoD"), the United States Postal Service ("USPS"), federal civilian agencies, and commercial and other customers. Our largest customers are the DoD and the USPS. Our operations include supply chain management solutions, parts supply and distribution, and maintenance, repair, and overhaul (“MRO”) services for vehicle fleet, aviation, and other clients; vehicle and equipment maintenance and refurbishment; logistics; engineering; energy services; IT and health care IT solutions; and consulting services.
VSE was incorporated in Delaware in 1959 and the parent company serves as a centralized managing and consolidating entity for our three operating groups, each of which consists of one or more wholly owned subsidiaries or unincorporated divisions that perform our services. VSE’s operating groups consist of our Supply Chain Management Group, Aviation Group, and Federal Services Group. The term "VSE" or "Company" means VSE and its subsidiaries and divisions unless the context indicates operations of only VSE as the parent company.
(b) Financial Information
Our operations are conducted within three reportable segments aligned with our operating groups: (1) Supply Chain Management, which generated approximately 31% of our revenues in 2018; (2) Aviation, which generated approximately 21% of our revenues in 2018; and (3) Federal Services, which generated approximately 48% of our revenues in 2018. Additional financial information for our reportable segments appears in Item 7 "Management’s Discussion and Analysis of Financial Condition and Results of Operations” and in Item 8 "Financial Statements and Supplementary Data” of this Form 10-K.
(c) Description of Business
Products and Services
We apply a broad array of capabilities and resources to support our clients’ transportation assets, vehicle fleets, aircraft, systems, equipment and processes. We focus on creating value by sustaining the life and improving the performance of our client assets through core offerings in supply chain management, MRO, equipment refurbishment, logistics and engineering. We also provide IT solutions, health care IT, and consulting services.
Typical offerings include supply chain and inventory management services; vehicle fleet sustainment programs; vehicle fleet parts supply and distribution; MRO of aircraft engines and engine components; aircraft engine parts supply and distribution; engineering support for military vehicles; military equipment refurbishment and modification; ship MRO and follow-on technical support; logistics management support; machinery condition analysis; specification preparation for ship alterations; ship’s force crew training; life cycle support for ships; ship communication systems; energy conservation, energy efficiency, sustainable energy supply, and electric power grid modernization projects; technology road-mapping; IT enterprise architecture development, information assurance/business continuity, security risk management, and network services; medical logistics; and medical command and control. See Item 7 “Management’s Discussion and Analysis of Financial Condition and Results of Operations” below for more information regarding our business.
Revenues and Contracts
Our revenues are derived from the delivery of products and from contract services performed for our customers. We offer our products and professional and technical services through various ordering agreements and negotiated and competitive contract arrangements.
Our Supply Chain Management Group revenues result from the sale of vehicle parts to the USPS and other government and commercial clients. We recognize revenue from the sale of vehicle parts when the customer takes ownership of the parts.
Our Aviation Group revenues result from the sale of aircraft parts and performance of MRO services for private and commercial aircraft owners, other aviation MRO providers, aviation original equipment manufacturers, and other government clients. Our Aviation Group recognizes revenues at a point in time for the sale of aircraft parts when control is transferred to the customer, which usually occurs when the parts are shipped. Our Aviation Group recognizes revenues for MRO services over time as the services are transferred to the customer. MRO services revenue recognized is measured based on the cost-to-cost input method, as costs incurred reflect the work completed, and therefore the services transferred to date.
Our Federal Services Group revenues result from professional and technical services, which we perform for customers on a contract basis. Revenue is recognized for performance obligations over time as we transfer the services to the customer. The three primary types of contracts used are cost-type, fixed-price and time and materials. Revenues result from work performed on these contracts by our employees and our subcontractors and from costs for materials and other work related costs allowed under our contracts. Revenues on cost-type contracts are recorded as contract allowable costs are incurred and fees are earned. Revenues on fixed-price contracts are recorded as work is performed over the period. Revenue is recognized over time using costs incurred to date relative to total estimated costs at completion to measure progress toward satisfying our performance obligations. Revenues for time and materials contracts are recorded based on the amount for which we have the right to invoice our customers, because the amount reflects the value of our work performed for the customer.
The USPS, U.S. Navy, and U.S. Army are our largest customers. Our customers also include various other government clients and commercial entities.
|
| | | | | | | | | | | | | | | | | | |
| | Revenues by Customer (dollars in thousands) Years ended December 31, |
Customer | | 2018 | | % | | 2017 | | % | | 2016 | | % |
USPS | | $ | 175,339 |
| | 25.1 | | $ | 180,205 |
| | 23.7 | | $ | 181,215 |
| | 26.2 |
| | | | | | | | | | | | |
U.S. Navy | | 160,952 |
| | 23.1 | | 206,644 |
| | 27.2 | | 190,155 |
| | 27.5 |
U.S. Army | | 156,519 |
| | 22.5 | | 188,462 |
| | 24.8 | | 139,764 |
| | 20.2 |
U.S. Air Force | | 17,023 |
| | 2.4 | | 7,123 |
| | 0.9 | | 3,482 |
| | 0.5 |
Total - DoD | | 334,494 |
| | 48.0 | | 402,229 |
| | 52.9 | | 333,401 |
| | 48.2 |
| | | | | | | | | | | | |
Commercial Aviation | | 135,864 |
| | 19.5 | | 126,960 |
| | 16.7 | | 131,067 |
| | 19.0 |
Other Commercial | | 14,742 |
| | 2.1 | | 12,498 |
| | 1.7 | | 10,721 |
| | 1.5 |
Total - Commercial | | 150,606 |
| | 21.6 | | 139,458 |
| | 18.4 | | 141,788 |
| | 20.5 |
| | | | | | | | | | | | |
Other Government | | 36,779 |
| | 5.3 | | 38,221 |
| | 5.0 | | 35,386 |
| | 5.1 |
| | | | | | | | | | | | |
Total | | $ | 697,218 |
| | 100.0 | | $ | 760,113 |
| | 100.0 | | $ | 691,790 |
| | 100.0 |
Backlog
Funded backlog represents a measure of potential future revenues from work performed by our Federal Services Group on government contracts. Funded backlog is defined by us as the total value of contracts that has been appropriated and funded by the procuring agencies, less the amount of revenues that have already been recognized on such contracts. Our reported backlog is comprised of funding received by us in incremental amounts for work that is generally expected to be completed within six to 12 months following the award of the funding. Our funded backlog for our Federal Services Group as of December 31, 2018, 2017 and 2016 was approximately $290 million, $324 million and $322 million, respectively. Changes in funded backlog on contracts are sometimes unpredictable due to uncertainties associated with changing government program priorities and availability of funds, which is heavily dependent upon the congressional authorization and appropriation process. Delays in this process may temporarily diminish the availability of funds for ongoing and planned work.
In addition to funded backlog levels, we have contract ceiling amounts available for use on multiple award, indefinite delivery, indefinite quantity contracts with DoD and federal civilian agencies. While these contracts increase the opportunities available for us to pursue future work, the actual amount of future work is indeterminate until task orders are placed on the contracts. Frequently, these task orders are competitively awarded. Additionally, these task orders must be funded by the procuring agencies before we can perform work and begin generating revenues.
Marketing
Our marketing activities are conducted at the operating group level by our marketing and business development staff and our professional staff of sales representatives, managers, and other personnel. New customer contacts and information concerning new programs, requirements and opportunities become available through attendance at industry trade shows and events, through sales calls and client servicing, through negotiation with key business partners, through formal and informal briefings, from participation in professional organizations, in the course of contract performance, and from literature published by government, trade associations, professional organizations and commercial entities.
Personnel
Our employees have a variety of specialized experience, training and skills that provide the expertise required to service our clients. Some have high levels of education. As of December 31, 2018, we had 2,228 employees, compared to 2,306 as of December 31, 2017. Principal employee categories include (a) mechanics and vehicle, aircraft and equipment technicians, (b) logisticians, (c) warehouse and sales personnel, (d) engineers and technicians in mechanical, electronic, industrial, energy services, and (e) information technology professionals in computer systems, applications and products, configuration, change and data management disciplines. The expertise required by our customers frequently includes knowledge of government regulations and procedures.
We actively seek initiatives and participate in outreach programs to assist individuals who have served in the U.S. Armed Forces. These efforts include an emphasis on hiring military veterans, which we believe enhances the quality of our workforce. Approximately 30% of our employees have previously served as members in the U.S. Armed Forces.
Competition
The supply chain, logistics, and MRO services offered by our Supply Chain Management and Aviation groups and the federally contracted professional and technical services offered by our Federal Services Group are conducted in very competitive operating environments. The vehicle parts aftermarket and aviation parts and servicing markets are fragmented, with many large and small competitors that compete for our customer base.
Large diversified federal contracting firms with greater financial resources and larger technical staffs are capable of providing the same services offered by us. Government agencies emphasize awarding contracts on a competitive basis as opposed to a sole source or other noncompetitive basis. Most of the significant contracts under which we currently perform services were either initially awarded on a competitive basis or have been renewed at least once on a competitive basis. There is no assurance regarding the level of work we may obtain under some of these contracts. Government budgets, and in particular the budgets of certain government agencies, can also affect competition in our business. A reallocation of government spending priorities or reallocation of work for small business set-aside programs that results in lower levels of potential business in the markets we serve or the services we offer will cause increased competition.
The extent of competition that we will encounter as a result of changing economic or competitive conditions, customer requirements or technological developments is unpredictable. We believe the principal competitive factors for our business are customer knowledge, technical and financial qualifications, past performance, government budgetary stress, and price, which has been more heavily weighted in recent years.
Available Information
Copies of our publicly available Annual Reports on Form 10-K, Quarterly Reports on Form 10-Q, Current Reports on Form 8-K and amendments to those reports are filed with or otherwise furnished to the Securities and Exchange Commission (“SEC”) pursuant to Section 13(a) or 15(d) of the Securities Exchange Act of 1934, as amended. Such reports and amendments are also available to the public free of charge through our website www.vsecorp.com as soon as reasonably practicable after the reports are electronically filed with the SEC.
ITEM 1A. Risk Factors
Our future results may differ materially from past results and from those projected in the forward-looking statements contained in this Form 10-K due to various uncertainties and risks, including those risks set forth below, nonrecurring events and other important factors disclosed previously and from time to time in our other reports filed with the SEC.
Uncertain government budgets and shifting government priorities could delay contract awards and funding and adversely affect our ability to continue work under our government contracts. Additionally, federal procurement directives could result in our loss of work on current programs to small business set-asides and large multiple award contracts.
Our government business is subject to funding delays, terminations (including at the government's convenience), reductions, in-sourcing, extensions and moratoriums associated with the government’s budgeting and contracting process. The federal procurement environment is unpredictable and could adversely affect our ability to perform work under new and existing contracts. We have experienced delays in contract awards and funding on our contracts in recent years that have adversely affected our ability to continue existing work and to replace expiring work. Additionally, our government business is subject to the risk that one or more of our potential contracts or contract extensions may be diverted by the contracting agency to a small or disadvantaged or minority-owned business pursuant to set-aside programs administered by the U.S. Small Business Administration, or may be bundled into large multiple award contracts for very large businesses. These risks can potentially have an adverse effect on our revenue growth and profit margins.
Increased market competition resulting from decreases in government spending for contract services and government contracting award criteria could adversely affect our ability to sustain our revenue levels.
Pressure on government budgets may adversely affect the flow of work to federal contractors, particularly new programs. Competitor contractors that experience a loss of government work have tended to redirect their marketing efforts toward the types of work that we perform. This increase in competition for our service offerings has adversely affected our ability to win new work or successor contracts to continue work that is currently performed by us under expiring contracts. Unsuccessful bidders frequently protest contract awards, which can delay or reverse the contract awards. Additionally, the government has frequently used contract award criteria that emphasizes lowest price, technically acceptable bids, which further intensifies competition in our government markets.
Certain programs comprise a material portion of our revenue. Our work on large government programs presents a risk to revenue growth and sustainability and profit margins.
The eventual expiration of large government programs or the loss of or disruption of revenues on a single contract may reduce our revenues and profits. Such revenue losses could also erode profits on our remaining programs that would have to absorb a larger portion of the fixed corporate costs previously allocated to the expiring programs or discontinued contract work. Our USPS managed inventory program (“MIP”) and our foreign military sales program with the U.S. Navy (“FMS Program”) each constitute a material portion of our revenues. This concentration of our revenue subjects us to risk of material adverse revenue disruptions if customer operational decisions, government contractual or other issues prevent or delay the fulfillment of work requirements associated with these key programs. In recent years, revenue levels for our FMS Program have fluctuated widely enough to cause material changes in our overall revenue levels and affect our profit margins. Similarly, variations in volume and types of parts purchased by the USPS in recent years have caused changes in our profit margins.
The USPS has initiated a fleet replacement program for a next generation of the delivery vehicle fleet. The timing of both the roll out of a new fleet and the retirement of the current vehicles and their decision on how many of such vehicles will remain in the fleet could potentially have a significant affect on our future revenues and profits.
Global economic conditions and political factors could adversely affect our revenues.
Revenues from our government programs for which work is performed in foreign countries are subject to economic conditions in these countries and to political risks posed by ongoing foreign conflicts and potential terrorist activity. Services performed by our employees on our FMS Program are, to a certain extent, dependent on our placement of employees in a client country. Significant domestic and political unrest in client countries can constrain our ability to maintain consistent staffing levels, resulting in a fluctuating level of services performed by our employees. We cannot predict when these conditions will occur or the effect it will have on our FMS Program revenues. Regime changes in these countries can result in government restrictions upon the continuation of ongoing work.
Economic conditions in both the United States and foreign countries, and global prices and availability of oil and other commodities could potentially have an adverse effect on the demand for some of our services, including our aviation services.
Due to the nature of our work we could potentially be exposed to legal actions arising from our operations.
Our work includes many manual tasks, including warehousing, shipping and packing of truck parts inventory, maintaining and repairing military and non-military vehicles, aircraft and equipment, and maintaining and overhauling U.S. Navy ships. Some of our work efforts involve the handling of hazardous materials. These services may pose certain challenges that could cause us to be exposed to legal and other liabilities arising from performance issues, work related incidents or employee misconduct that result in damages, injury or death to third parties. Such events could cause us to suffer financial losses and adversely affect our financial condition. (See Item 3. "Legal Proceedings” below.)
Technology security and cyber-attack risks could potentially impact our financial results.
We face the threat to our computer systems of unauthorized access, computer hackers, computer viruses, malicious code, organized cyber-attacks and other security problems and system disruptions, including possible unauthorized access to our and our clients' proprietary or classified information.
Some of our contract work includes data management and technology services associated with Social Security Administration and military medical and health records. This exposes us to certain information and technology security risks. If there is a security breach of sensitive data in our custody or for which we provide services, we could possibly be held liable for damages to third parties related to such security breach and incur costs to prevent future incidents. We also provide refurbishment, maintenance and training services support to international clients directly and through DoD. Foreign nations with interests that conflict with the international clients we support could be motivated to conduct a cyber-attack to access information on these programs.
We maintain a cybersecurity risk management program to monitor and mitigate cybersecurity threats and an incident response plan for emerging threats. Costs associated with preventing or remediating information management security breaches or complying with related laws and regulations have not had a material adverse effect on our capital expenditures, earnings or competitive position. Additionally, we have obtained insurance that provides coverage for certain cybersecurity incidents. However, the occurrence of a future security breach event could potentially have such an adverse effect.
Acquisitions, which have been a part of our business strategy in recent years, present certain risks.
The acquisition of a business that subsequently does not meet expected operating and financial performance targets, the ineffective integration of an acquisition, our inability to service debt associated with an acquisition, or the failure to timely complete an acquisition could adversely affect our financial performance or condition.
The nature of our operations and work performed by our employees present certain challenges related to work force management.
Our financial performance is heavily dependent on the abilities of our operating and administrative staff with respect to technical skills, operating performance, pricing, cost management, safety, and administrative and compliance efforts. A wide diversity of contract types, nature of work, work locations, and legal and regulatory complexities challenges our administrative staff and skill sets. We also face challenges associated with our quality of workforce, quality of work, safety, and labor relations compliance. Our current and projected work in foreign countries exposes us to challenges associated with export and ethics compliance, local laws and customs, workforce issues, extended supply chain, political unrest and war zone threats. Failure to attract or retain an adequately skilled workforce, lack of knowledge or training in critical functions, or inadequate staffing levels can result in lost work, reduced profit margins, losses from cost overruns, performance deficiencies, workplace accidents, and regulatory noncompliance.
Our business could be adversely affected by incidents that could cause an interruption in our operations or impose a significant financial liability on us.
Disruption of our operations due to internal or external system or service failures, accidents or incidents involving employees or third parties working in high-risk locations, or natural disasters or other crises could adversely affect our financial performance and condition. A fire, flood, earthquake, or other natural disaster at physical facilities that support key revenue generating operations, or a procurement system or contractual delay could potentially interrupt the revenues from our operations.
We are subject to numerous government rules and regulations that could expose us to potential liabilities or work loss.
We must comply with and are affected by laws and regulations relating to the award, administration and performance of government contracts. A violation of laws or regulations could result in the imposition of fines and penalties or the termination of contracts or debarment from working or bidding on government contracts.
In some instances, these government contract laws and regulations impose terms or rights that are significantly more favorable to the government than those typically available to commercial parties in negotiated transactions. For example, the government may terminate any government contract or subcontract at its convenience, as well as for performance default.
A termination for default could expose us to liability and have a material adverse effect on our ability to compete for future contracts and orders. A termination for default could also impact our past performance and ability to obtain new or additional work. In addition, the government could terminate a prime contract under which we are a subcontractor, irrespective of the quality of services provided by us as a subcontractor.
Additionally, our contract work that is performed by our subcontractors is subject to government compliance, performance requirements and financial risks. If any of our subcontractors fail to timely meet their contractual obligations or have regulatory compliance or other problems, our ability to fulfill our obligations as a prime contractor may be jeopardized.
The aviation industry is highly regulated by the U.S. Federal Aviation Administration ("FAA") and similar regulatory agencies in other countries. Aviation engines and engine components that we sell must meet certain airworthiness standards established by the FAA or the equivalent agencies in certain other countries. We also operate repair facilities that are licensed by the FAA and equivalent agencies of certain other countries to perform such services. New and more stringent regulations may be adopted in the future that could have an adverse effect on us.
Our business could be adversely affected by government audits or investigations.
Government agencies, including the Defense Contract Audit Agency, the Defense Contract Management Agency and the Department of Labor, routinely audit and investigate government contractors. These agencies review a contractor’s performance under its contracts, cost structure and compliance with applicable laws, regulations and standards. The government also may review the adequacy of, and a contractor’s compliance with, its internal control systems and policies, including the contractor’s purchasing, property, estimating, compensation and management information systems. Any costs found to be improperly allocated to a specific contract will not be reimbursed and any such costs already reimbursed must be refunded.
The scope and rigor of government agency audits and investigations have increased in recent years, resulting in a greater likelihood that an audit or investigation may result in an adverse outcome. We have been subject to unfavorable findings and recommendations from various government agencies from time to time. We expect that government agencies will continue to rigorously audit and investigate us and there may be adverse or disputed findings, resulting in corrective action plans and/or settlements.
If an audit or investigation uncovers improper or illegal activities, we may be subject to civil and criminal penalties and administrative sanctions, including termination of contracts, forfeiture of profits, suspension of payments, fines and suspension or debarment from doing business with the government. In addition, we could suffer serious harm to our reputation if allegations of impropriety were made. Performance of international work can expose us to risks associated with the Foreign Corrupt Practices Act and Export Control Act compliance.
Investments in facilities could cause losses if certain work is disrupted or discontinued.
We have made investments in facilities and lease commitments to support specific business programs, work requirements, and service offerings. A slowing or disruption of these business programs, work requirements, or service offerings that results in operating below intended levels could cause us to suffer financial losses.
Environmental and pollution risks could potentially impact our financial results.
Some of our contract work includes the use of chemical solvents and the handling of hazardous materials to maintain, repair, and refurbish vehicles, aircraft engines, and equipment. This exposes us to certain environmental and pollution risks. Costs associated with compliance with Federal, State and local provisions regulating the discharge of materials or that otherwise relate to the protection of the environment have not had a material adverse effect on our capital expenditures, earnings, or competitive
position. However, we cannot predict the likelihood of such a material adverse effect should we experience the occurrence of a future environmental or pollution event.
ITEM 1B. Unresolved Staff Comments
None.
ITEM 2. Properties
Our executive and administrative headquarters are located in a five-story building in Alexandria, Virginia, with approximately 95,000 square feet of office space leased by us through April 2027.
We own facilities located in an industrial park in Somerset, Pennsylvania that we use to conduct our Supply Chain Management Group operations. These properties consist of approximately 30 acres of land and buildings totaling approximately 271,000 square feet of office, engineering and warehouse space.
We own two properties that we use to conduct our Aviation Group operations. One property consists of approximately one acre of land and a building with approximately 14,000 square feet of warehouse and office space in Miami, Florida. The other property consists of a building with approximately 30,500 square feet of warehouse and office space in Independence, Kansas that is located on leased municipal airport land.
We own and operate two facilities in Ladysmith, Virginia. One of these properties consists of approximately 44 acres of land and multiple storage and vehicle maintenance buildings totaling approximately 56,000 square feet of space. The other property consists of 30 acres of land and buildings totaling approximately 13,500 square feet of space. We also own and operate two properties in Texarkana, Arkansas consisting of an aggregate of approximately 16 acres of land and buildings totaling approximately 114,000 square feet. We use these properties primarily to provide refurbishment services for military equipment, storage and maintenance.
We also provide services and products from facilities generally occupied under short-term leases primarily located near customer sites to facilitate communications and enhance program performance. As of December 31, 2018, we leased approximately 18 such facilities with a total of approximately 327,000 square feet of office, shop and warehouse space. Our employees often provide services at customer facilities, limiting our requirement for additional space. We also provide services from locations outside of the United States, generally at foreign shipyards, U.S. military installations and aircraft parts distribution facilities.
ITEM 3. Legal Proceedings
On or about April 19, 2018 Joseph Waggoner, on behalf of himself and all similarly situated individuals, filed a lawsuit against VSE and two of our subcontractors in the United State District Court, Eastern District of Texas, Texarkana Division, alleging overtime compensation entitlement at a rate of one and one-half times their regular rate of pay for all hours worked over 40 hours in a workweek. The plaintiffs have certified the case as a collective action for similarly situated individuals. The plaintiffs work under a contract between defendants and the United States Army at the Red River Army Depot in Texas. The plaintiffs assert that employees' 15-minute unpaid work breaks should have been included as "working hours" in calculating overtime. We believe it is probable that VSE will incur a loss related to this matter. We have accrued an immaterial loss provision for this matter in an amount that represents our reasonable estimate related to an unfavorable settlement of the matter, and we do not believe that we have any further exposure that would be material to VSE in excess of the amount we have accrued in respect of this matter.
In addition to the above-referenced legal proceeding, we may have certain claims in the normal course of business, including legal proceedings, against us and against other parties. In our opinion, the resolution of these other claims will not have a material adverse effect on our results of operations, financial condition, or cash flows. However, because the results of any legal proceedings cannot be predicted with certainty, the amount of loss, if any, cannot be reasonably estimated.
Further, from time-to-time, government agencies audit or investigate whether our operations are being conducted in accordance with applicable contractual and regulatory requirements. Government audits and investigations of us, whether relating to government contracts or conducted for other reasons, could result in administrative, civil or criminal liabilities, including repayments, fines or penalties being imposed upon us, or could lead to suspension or debarment from future government contracting. Government audits and investigations often take years to complete and many result in no adverse action against us. We believe, based upon current information, that the outcome of any such government disputes and investigations or related disputes will not have a material adverse effect on our results of operations, financial condition or cash flows.
ITEM 4. Mine Safety Disclosures
Not applicable.
ITEM 4(a). Executive Officers of Registrant
Our executive officers are listed below, as well as information concerning their age and positions held with VSE. There is no family relationships between any of our executive officers. The executive officers are appointed annually to serve until the first meeting of VSE's Board of Directors (the "Board") following the next annual meeting of stockholders and until their successors are elected and have qualified, or until death, resignation or removal, whichever is sooner.
|
| | | | |
Name | | Age | | Position with Registrant |
Joseph R. Brown | | 62 | | President, Federal Services Group |
Maurice A. Gauthier | | 71 | | Director, Chief Executive Officer, President and Chief Operating Officer |
Paul W. Goffredi | | 61 | | President, VSE's subsidiary VSE Aviation, Inc. |
Thomas M. Kiernan | | 51 | | Vice President, General Counsel and Secretary |
Thomas R. Loftus | | 63 | | Executive Vice President and Chief Financial Officer |
Chad Wheeler | | 44 | | President, VSE's subsidiary Wheeler Bros., Inc. |
Mr. Brown has served as President of the Federal Services Group since May 2015. Mr. Brown brings over 20 years of experience as a program and business unit manager at VSE. Mr. Brown leads a team whose primary focus is refurbishment services to extend and enhance the life of existing vehicles and equipment, fleet-wide ship and aircraft support, aircraft sustainment and maintenance, foreign military sales and other technical, management, engineering, logistics, maintenance, configuration management, prototyping, technology, and field support services to the U.S. Navy and Marine Corps, U.S. Army and Army Reserve, U.S. Air Force and other U.S. and foreign military customers. Prior to joining VSE in 1996, Mr. Brown served 20 years active duty in the U.S. Navy. He received a Bachelor of Business Administration degree from University of Maryland University College and an Associate of Science in Mechanical Engineering degree from the University of Tennessee at Knoxville.
Mr. Gauthier has served as VSE's Chief Executive Officer, President and Chief Operating Officer since April 2008, and has served as a Board member since February 2009.
Mr. Goffredi has served as President and Chief Operating Officer of our subsidiary VSE Aviation, Inc. since January 2015, when VSE Aviation, Inc. acquired Prime Turbines LLC (including both U.S. and Germany-based operations), CT Aerospace LLC, Kansas Aviation of Independence, L.L.C. and Air Parts & Supply Co. His focus and background includes business development, strategic original equipment manufacturer ("OEM") and major customer relations, supply chain management, engine and material acquisition, and operational excellence and improvement. Prior to joining VSE, Mr. Goffredi served for three years as Chief Operating Officer for Killick Aerospace, and 13 years with BBA Aviation as Program Director for all Honeywell Engine Programs. Mr. Goffredi received a Business Administration degree from Mesa State College (Colorado) and MBA in Marketing and Finance degree from The University of St. Thomas (Texas).
Mr. Kiernan has served as VSE's Vice President, General Counsel and Secretary since November 2008.
Mr. Loftus has served as VSE's Chief Financial Officer and Executive Vice President since March 2002. Mr. Loftus has served in various roles of increasing responsibility at VSE since 1978, and served as VSE's Comptroller, Senior Vice President and Corporate Tax Director from March 1999 to February 2002.
Mr. Wheeler has served as President and Chief Operating Officer of our subsidiary Wheeler Bros., Inc. ("WBI") since July 2013. Since 1991, Mr. Wheeler has served in various roles at WBI, including Senior Vice President of Operations, Senior Vice President of Sales and Marketing, and Marketing and Sales Manager. While serving as Marketing and Sales Manager, Mr. Wheeler coordinated implementation of WBI's Managed Inventory Program which is used at the USPS' Vehicle Maintenance Facilities throughout the country. Mr. Wheeler received a Marketing degree from Indiana University of Pennsylvania.
PART II
ITEM 5. Market for Registrant's Common Equity, Related Stockholder Matters and Issuer Purchases of Equity Securities
VSE common stock, par value $0.05 per share, is traded on The NASDAQ Global Select Market, trading symbol, "VSEC," Newspaper listing, "VSE."
(a)Common Stock - Dividend Paid Per Share
|
| | | | | | | | |
| | Dividend Paid Per Share |
Quarter Ended | | 2018 | | 2017 |
March 31 | | $ | 0.07 |
| | $ | 0.06 |
|
June 30 | | 0.08 |
| | 0.07 |
|
September 30 | | 0.08 |
| | 0.07 |
|
December 31 | | 0.08 |
| | 0.07 |
|
For the Year | | $ | 0.31 |
| | $ | 0.27 |
|
(b)Holders
As of February 1, 2019, VSE common stock, par value $0.05 per share, was held by approximately 239 stockholders of record. The number of stockholders of record is not representative of the number of beneficial holders because many of VSE's shares are held by depositories, brokers or nominees.
(c)Dividends
Pursuant to our bank loan agreement (see Note 7, Debt, of "Notes to Consolidated Financial Statements" in Item 8 of this Form 10-K), the payment of cash dividends is subject to annual restrictions. We have paid cash dividends each year since 1973 and have increased our dividend each year since 2004.
(d)Certain Sales and Repurchases of VSE Common Stock
During the fiscal year covered by this Form 10-K, VSE did not sell any of its equity securities that were not registered under the Securities Act of 1933, as amended. During the fourth quarter of the fiscal year covered by this Form 10-K, no purchases of equity securities of VSE were made by or on behalf of VSE or any "affiliated purchaser" (as defined in Rule 10b-18 (a)(3) under the Securities Exchange Act of 1934, as amended) other than 13,609 shares of our restricted common stock that were voluntarily forfeited to VSE by participants in its 2006 Restricted Stock Plan to cover their personal tax liability for restricted stock awards under the VSE Corporation 2006 Restricted Stock Plan (the "2006 Plan").
(e)Equity Compensation Plan Information
We have two compensation plans approved by our stockholders under which our equity securities are authorized for issuance to employees and directors: (i) the VSE Corporation 2004 Non-Employee Directors Stock Plan and (ii) the 2006 Plan.
As of December 31, 2018, 127,427 shares of VSE common stock were available for future issuance under the VSE Corporation 2004 Non-Employee Directors Stock Plan and 394,173 shares of VSE common stock were available for future issuance under the 2006 Plan.
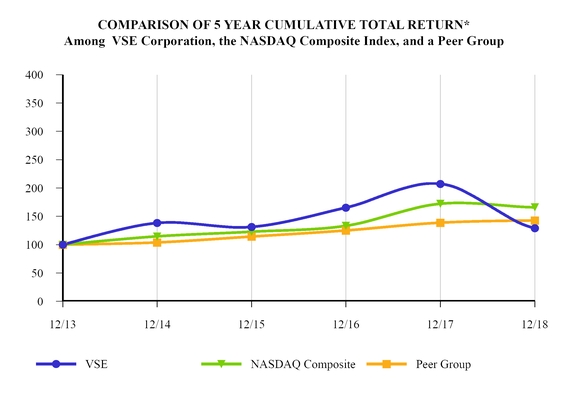
Performance Graph
Set forth below is a line graph comparing the cumulative total return of VSE common stock with (a) a performance index for the broad market (The NASDAQ Global Select Market) on which VSE common stock is traded and (b) a published industry index. VSE common stock is traded on The NASDAQ Global Select Market, and our industry group is engineering and technical services (formerly SIC Code 8711). Accordingly, the performance graph compares the cumulative total return for VSE common stock with (a) an index for The NASDAQ Global Select Market (U.S. companies) ("NASDAQ Index") and (b) our peer group.
*$100 invested on 12/31/13 in stock or index, including reinvestment of dividends.
Fiscal year ending December 31.
Performance Graph Table
|
| | | | | | | | | | | |
| 2013 | | 2014 | | 2015 | | 2016 | | 2017 | | 2018 |
VSE | 100 | | 138.18 | | 131.29 | | 165.19 | | 207.24 | | 128.90 |
NASDAQ Composite | 100 | | 114.62 | | 122.81 | | 133.19 | | 172.11 | | 165.84 |
Peer Group | 100 | | 103.89 | | 114.25 | | 125.04 | | 138.74 | | 142.69 |
ITEM 6. Selected Financial Data
(in thousands, except per share data)
|
| | | | | | | | | | | | | | | | | | | |
| Years ended December 31, |
| 2018 | | 2017 | | 2016 | | 2015 | | 2014 |
| | | | | | | | | |
Revenues | $ | 697,218 |
| | $ | 760,113 |
| | $ | 691,790 |
| | $ | 533,982 |
| | $ | 424,071 |
|
| | | | | | | | | |
Income from continuing operations | $ | 35,080 |
| | $ | 39,096 |
| | $ | 26,793 |
| | $ | 24,918 |
| | $ | 20,489 |
|
Loss from discontinued operations | — |
| | — |
| | — |
| | — |
| | (1,124 | ) |
Net income (1) | $ | 35,080 |
| | $ | 39,096 |
| | $ | 26,793 |
| | $ | 24,918 |
| | $ | 19,365 |
|
| | | | | | | | | |
Basic earnings per share: | | | | | | | | | |
Income from continuing operations | $ | 3.23 |
| | $ | 3.61 |
| | $ | 2.48 |
| | $ | 2.32 |
| | $ | 1.91 |
|
Loss from discontinued operations | — |
| | — |
| | — |
| | — |
| | (0.10 | ) |
Net income (1) | $ | 3.23 |
| | $ | 3.61 |
| | $ | 2.48 |
| | $ | 2.32 |
| | $ | 1.81 |
|
| | | | | | | | | |
Diluted earnings per share: | | | | | | | | | |
Income from continuing operations | $ | 3.21 |
| | $ | 3.60 |
| | $ | 2.47 |
| | $ | 2.31 |
| | $ | 1.91 |
|
Loss from discontinued operations | — |
| | — |
| | — |
| | — |
| | (0.10 | ) |
Net income (1) | $ | 3.21 |
| | $ | 3.60 |
| | $ | 2.47 |
| | $ | 2.31 |
| | $ | 1.81 |
|
| | | | | | | | | |
Cash dividends per common share | $ | 0.310 |
| | $ | 0.270 |
| | $ | 0.235 |
| | $ | 0.215 |
| | $ | 0.195 |
|
(1) 2018 and 2017 Net income and basic and diluted earnings per share were impacted by the Tax Cuts and Jobs Act. See Note 10 "Income Taxes" to our Consolidated Financial Statements included below in Item 8.
|
| | | | | | | | | | | | | | | | | | | |
| As of December 31, |
| 2018 | | 2017 | | 2016 | | 2015 | | 2014 |
| | | | | | | | | |
Working capital | $ | 176,342 |
| | $ | 134,563 |
| | $ | 110,021 |
| | $ | 100,780 |
| | $ | 33,037 |
|
| | | | | | | | | |
Total assets | $ | 638,828 |
| | $ | 629,013 |
| | $ | 661,839 |
| | $ | 617,354 |
| | $ | 353,430 |
|
| | | | | | | | | |
Long-term debt | $ | 151,133 |
| | $ | 165,614 |
| | $ | 193,621 |
| | $ | 215,243 |
| | $ | 23,483 |
|
| | | | | | | | | |
Long-term lease obligations | $ | 18,913 |
| | $ | 20,581 |
| | $ | 21,959 |
| | $ | 23,251 |
| | $ | 24,584 |
|
| | | | | | | | | |
Stockholders' equity | $ | 328,395 |
| | $ | 293,095 |
| | $ | 255,194 |
| | $ | 229,309 |
| | $ | 205,489 |
|
This consolidated summary of selected financial data should be read in conjunction with Management's Discussion and Analysis of Financial Condition and Results of Operations included in Item 7 of this Form 10-K and with the Consolidated Financial Statements and related Notes included in Item 8 of this Form 10-K. Results for reporting periods beginning after January 1, 2018 are presented under the adoption of ASU 2014-09, Revenue from Contracts with Customers (Topic 606), while prior period amounts are not adjusted and continue to be reported in accordance with previous guidance. The historical results set forth in this Item 6 are not necessarily indicative of VSE's future results of operations.
ITEM 7. Management’s Discussion and Analysis of Financial Condition and Results of Operations
Executive Overview
Customers and Services
We are a diversified services and supply chain management company that assists our customers in sustaining, extending the service life, and improving the performance of their transportation equipment and other assets and systems. We provide logistics and distribution services for legacy systems and equipment and professional and technical services to the United States Government (the "government"), including the United States Department of Defense ("DoD"), the United States Postal Service ("USPS") and federal civilian agencies, and to commercial and other customers. Our largest customers are the DoD and the USPS. Our operations include supply chain management solutions, parts supply and distribution, and maintenance, repair, and overhaul (“MRO”) services for vehicle fleet, aviation, and other customers; vehicle and equipment maintenance and refurbishment; logistics; engineering; energy services; IT and health care IT solutions; and consulting services. See Item 1 “Business - Revenues and Contracts” above for revenues by customer.
Acquisition
In January 2019, we acquired 1st Choice Aerospace Inc. ("1st Choice Aerospace"), two privately owned aviation companies with operations in Florida and Kentucky that provide component MRO services and products for new generation and legacy commercial aircraft families. 1st Choice Aerospace will operate as a subsidiary of VSE Aviation, Inc. under our Aviation Group. We have retained certain key management members of the former ownership group. See Note 17 "Subsequent Events" to our Consolidated Financial Statements included below in Item 8 for additional information regarding our acquisition of 1st Choice Aerospace.
Organization and Segments
Our operations are conducted within three reportable segments aligned with our management groups: 1) Supply Chain Management; 2) Aviation; and 3) Federal Services.
Supply Chain Management Group - Our Supply Chain Management Group provides sourcing, acquisition, scheduling, transportation, shipping, logistics, data management, and other services to assist our clients with supply chain management efforts. Operations of this group are conducted by our wholly owned subsidiary Wheeler Bros., Inc., which supports the USPS, commercial truck fleets, and DoD with fleet management and sustainment solutions, and managed inventory services. The primary revenue source for this group is derived from the sale of vehicle parts and mission critical supply chain services to support the USPS truck fleet.
Aviation Group - Our Aviation Group provides parts supply and distribution, supply chain solutions, and MRO services for commercial and general aviation jet aircraft engines and engine accessories. This group offers a range of complementary services and supplies to a diversified client base of commercial airlines, regional airlines, cargo transporters, MRO integrators and providers, aviation manufacturers, corporate and private aircraft owners, and agricultural clients.
Federal Services Group - Our Federal Services Group provides foreign military sales services, refurbishment services to extend and enhance the life of existing vehicles and equipment, fleet-wide ship and aircraft support, aircraft sustainment and maintenance, and other technical, management, engineering, logistics, maintenance, configuration management, prototyping, technology, and field support services to the U.S. Navy and Marine Corps, U.S. Army and Army Reserve, U.S. Air Force, and other customers. Significant work efforts for this group include assistance to the U.S. Navy in executing its Foreign Military Sales (“FMS”) Program for surface ships sold, leased or granted to foreign countries, our Red River Army Depot Equipment Related Services Program (“RRAD ERS”) providing on-site logistics support for Red River Army Depot at Texarkana, Texas, our Fort Benning Logistics Support Services Program supporting base operations and logistics at Fort Benning, Georgia, our U.S. Army Reserve vehicle refurbishment program and various vehicle and equipment refurbishment, maintenance and sustainment programs for U.S. Army commands, and various task orders under the U.S. Air Force Contract Field Teams (“CFT”) Program.
Our Federal Services Group also provides energy consulting services and IT solutions and services with a focus on medical and health related fields for various DoD and federal civilian agencies, including the United States Department of Energy ("DoE"); the Social Security Administration; the National Institutes of Health ("NIH"); customers in the military health system; and other government agencies and commercial clients.
Concentration of Revenues
|
| | | | | | | | | | | | | | | | | | |
|
| (in thousands) Years ended December 31, |
Source of Revenues | | 2018 | | % | | 2017 | | % | | 2016 | | % |
USPS | | $ | 175,339 |
| | 25 | | $ | 180,205 |
| | 24 | | $ | 181,215 |
| | 26 |
FMS Program* | | 147,875 |
| | 21 | | 185,556 |
| | 24 | | 169,754 |
| | 25 |
Other | | 374,004 |
| | 54 | | 394,352 |
| | 52 | | 340,821 |
| | 49 |
Total Revenues | | $ | 697,218 |
| | 100 | | $ | 760,113 |
| | 100 | | $ | 691,790 |
| | 100 |
* Our Aviation Group utilizes the Federal Services Group's FMS Program to sell its gas turbine MRO services to the DoD.
Management Outlook
Aviation Group
We believe that our January 2019 acquisition of 1st Choice Aerospace will provide a significant opportunity for revenue and profit growth for our Aviation Group. 1st Choice Aerospace is expected to broaden our product lines and client base, particularly in the commercial aerospace market, and we see opportunities to strategically align 1st Choice Aerospace’s offerings with our existing domestic and international markets, including our recent Singapore and European initiatives. For additional information regarding 1st Choice Aerospace, see Note 17 "Subsequent Events" to our Consolidated Financial Statement included below in Item 8.
Our Aviation Group has demonstrated improved performance in 2018, with contributions provided by both new and existing lines of business. We have increased revenue and operating profits on sales from new parts distribution and on MRO services on engine accessories and components. Our Singapore operation began generating revenue in the second quarter as we extended new product lines to new end-user clients in the Asia-Pacific market, including commercial airlines. We extended key distribution agreements to other geographic markets. We believe these efforts will provide us with sustainable revenue sources with viable growth potential, and that the associated investment in increased inventory will be beneficial to our future results. We expect the addition of 1st Choice Aerospace to accelerate our improved results without materially increasing our inventory investment. While revenues, operating income, and inventory may experience fluctuations due to market demand and the mix of products sold, we are optimistic about the performance of our Aviation Group.
Supply Chain Management Group
Our Supply Chain Management Group continues to make steady progress toward becoming a more diversified enterprise that is less reliant on a single large customer. Parts sales and supply chain and inventory management support services to DoD and commercial clients have shown steady increases as we capture new commercial customers. Our commercial client base now includes companies in a wide array of businesses that have vehicle fleets required to meet mission critical delivery or service schedules. We also are capturing new customers and increasing revenue using e-commerce solutions. We look forward to further developing these new client relationships and expect them to reflect a more significant portion of our revenue in the future.
Revenues from the sale of parts to the USPS declined about 3% in 2018. We are closely monitoring the USPS next-generation delivery vehicle (“NGDV”) procurement effort, which is progressing more slowly than the USPS had previously expected. We are positioning ourselves to support newly procured vehicles eventually placed in service and aging vehicles that remain in service. While it will likely be several years before the NGDV is placed in service in significant numbers, the USPS has begun some shorter-term annual vehicle acquisitions through the procurement of commercial off-the-shelf ("COTS") mass-market vehicles and the retirement of some of its aging COTS vehicles. The turnover of these COTS vehicles is the primary factor for the 3% revenue decline in 2018. As the new COTS vehicles begin to age, we expect the demand for replacement parts to keep them operating will return. As a matter of USPS practice, we are a provider of replacement parts for all 215,000 USPS vehicle fleet assets, including the COTS vehicles. While we cannot predict with certainty the impact of the USPS NGDV procurement and concurrent retirement of older fleet assets on our future revenues, we believe that our years of service, unique knowledge of this client’s complex operational model and maintenance facility processes and procedures, and our superior performance strategically position us to continue to serve as a key vehicle fleet sustainment partner regardless of source or vintage. We expect to continue supporting USPS during its comprehensive vehicle transition initiatives embracing emerging technologies spanning the next decade or longer.
Federal Services Group
The revenues from our FMS program in 2018 declined due to the completion of the transfer of two frigates to Taiwan in 2017 and procedural delays in the contracting process. Our Federal Services Group revenues were down in 2018 due to the FMS revenue decline, completion of work on two of our U.S. Army programs in 2017, a reduction in work performed on our RRAD ERS contract in May 2018 due to a client directed reduction in force, and a decline in our energy, and management consulting work. Despite these revenue challenges, our operating income has increased due to a gain on the sale of an IT services contract, margin improvements on some of our U. S. Army programs and the completion in 2017 of a contract that recorded a loss.
In the third quarter of 2018, we sold an IT services contract that we had been awarded by the NIH to a company with more extensive IT client relationships. As a result, we were able to monetize the value of the contract while retaining the work we were performing and maintain our access to the contract for future potential work.
Tax Cuts and Jobs Act
Public Law No. 115-97, enacted upon passage of the Tax Cuts and Jobs Act (the "Tax Act") on December 22, 2017, resulted in a one-time reduction in our deferred tax liabilities that lowered our provision for income taxes and correspondingly increased our net income by approximately $10.6 million for 2017. This was a non-cash event for 2017 resulting from the Tax Act that lowered the U.S. corporate income tax rate from 35% to 21% effective January 1, 2018.
Bank Debt
We reduced our bank debt during 2018 by approximately $11 million. In January 2018, we amended our bank loan agreement to extend the maturity date and increase our borrowing commitments, which positioned us to more responsively pursue and execute our acquisition of 1st Choice in January 2019. Despite the acquisition and increases of inventory levels associated with supporting our other Aviation growth initiatives, we remain well positioned to cover current operating needs and respond to future strategic opportunities.
Bookings and Funded Backlog
Revenues for government contract work performed by our Federal Services Group depend on contract funding (“bookings”), and bookings generally occur when contract funding documentation is received. Funded contract backlog is an indicator of potential future revenue. While bookings and funded contract backlog generally result in revenue, we may occasionally have funded contract backlog that expires or is de-obligated upon contract completion and does not generate revenue.
A summary of our bookings and revenues for our Federal Services Group for the years ended December 31, 2018, 2017 and 2016, and funded contract backlog for this group as of December 31, 2018, 2017 and 2016 is as follows (in millions):
|
| | | | | | | | | | | |
| 2018 | | 2017 | | 2016 |
Bookings | $ | 321 |
| | $ | 430 |
| | $ | 458 |
|
Revenues | $ | 337 |
| | $ | 411 |
| | $ | 353 |
|
Funded Backlog | $ | 290 |
| | $ | 324 |
| | $ | 322 |
|
Recently Issued Accounting Pronouncements
For a description of recently announced accounting standards, including the expected dates of adoption and estimated effects, if any, on our consolidated financial statements, see "Recently Issued Accounting Pronouncements" in Note 1 to our Consolidated Financial Statements included below in Item 8.
Critical Accounting Policies
Our consolidated financial statements are prepared in accordance with accounting principles generally accepted in the United States, which require us to make estimates and assumptions. We believe the following critical accounting policies affect the more significant accounts, particularly those that involve judgments, estimates and assumptions used in the preparation of our consolidated financial statements.
Revenue Recognition for 2018
We account for revenue in accordance with ASC 606. The unit of account in ASC 606 is a performance obligation. At the inception of each contract with a customer, we determine our performance obligations within the contract and the contract's transaction price. A performance obligation is a promise in a contract to transfer a distinct good or service to the customer, and is defined as the unit of account. A contract’s transaction price is allocated to each distinct performance obligation and recognized as revenue when the performance obligation is satisfied. The majority of our contracts have a single performance obligation as the promise to transfer the individual goods or services is not separately identifiable from other promises in the contracts and is, therefore, not distinct. For product sales, each product sold to a customer typically represents a distinct performance obligation. Our performance obligations are satisfied over time as work progresses or at a point in time based on transfer of control of products and services to our customers.
Contract modifications are routine in the performance of our contracts. Contracts are often modified to account for changes in contract specifications or requirements. In most instances, contract modifications are for goods or services that are not distinct, and therefore are accounted for as part of the existing contract.
Substantially all of our Supply Chain Management Group revenues from the sale of vehicle parts to customers is recognized at the point in time of the transfer of control to the customer. Sales returns and allowances for vehicle parts are not significant.
Our Aviation Group revenues result from the sale of aircraft parts and performance of MRO services for private and commercial aircraft owners, other aviation MRO providers, and aviation original equipment manufacturers. Our Aviation Group recognizes revenues at a point in time for the sale of aircraft parts when control is transferred to the customer, which usually occurs when the parts are shipped. Our Aviation Group recognizes revenues for MRO services over time as the services are transferred to the customer. MRO services revenue recognized is measured based on the cost-to-cost input method, as costs incurred reflect the work completed, and therefore the services transferred to date. Sales returns and allowances are not significant
Our Federal Services Group revenues result from professional and technical services, which we perform for customers on a contract basis. Revenue is recognized for performance obligations over time as we transfer the services to the customer. The three primary types of contracts used are cost-type, fixed-price and time and materials. Revenues result from work performed on these contracts by our employees and our subcontractors and from costs for materials and other work related costs allowed under our contracts.
Revenues on cost-type contracts are recorded as contract allowable costs are incurred and fees are earned. Variable consideration, typically in the form of an award fees, is included in the estimated transaction price, to the extent that it is probable that a significant reversal will not occur, when there is a basis to reasonably estimate the amount of the fee. These estimates are based on historical award experience, anticipated performance and our best judgment based on current facts and circumstances.
Revenues on fixed-price contracts are recorded as work is performed over the period. Revenue is recognized over time using costs incurred to date relative to total estimated costs at completion to measure progress toward satisfying our performance obligations. Incurred cost represents work performed, which corresponds with the transfer of control to the customer. For such contracts, we estimate total costs at the inception of the contract based on our assumptions of the cost elements required to complete the associated tasks of the contract and assess the affects of the risks on our estimates of total costs to complete the contract. Our cost estimates are based on assumptions that include the complexity of the work, our employee labor costs, the cost of materials, and the performance of our subcontractors. These cost estimates are subject to change as we perform under the contract and as a result, the timing of revenues and amount of profit on a contract may change as there are changes in estimated costs to complete the contract. Such adjustments are recognized on a cumulative catch-up basis in the period we identify the changes.
Revenues for time and materials contracts are recorded based on the amount for which we have the right to invoice our customers, because the amount directly reflects the value of our work performed for the customer. Time and materials contracts are recorded on the basis of contract allowable labor hours worked multiplied by the contract defined billing rates, plus the direct costs and indirect cost burdens associated with materials and subcontract work used in performance on the contract. Generally, profits on time and materials contracts result from the difference between the cost of services performed and the contract defined billing rates for these services.
We will occasionally perform work at risk, which is work performed prior to formalizing contract funding for such work. Revenue related to work performed at risk is not recognized until it can be reliably estimated and its realization is probable. We recognize this “risk funding” as revenue when the associated costs are incurred or the work is performed. We are at risk of loss for any risk funding not received. Revenues recognized as of December 31, 2018 include approximately $4.7 million for which we have not received formalized funding. We believe that we are entitled to reimbursement and expect to receive all of this funding.
Revenue Recognition for 2017 and 2016
Revenue is recognized when persuasive evidence of an arrangement exists, delivery has occurred or services have been rendered, the fee is fixed or determinable, and collectability is probable.
Substantially all of our Supply Chain Management Group revenues result from the sale of vehicle parts to clients. We recognize revenue from the sale of vehicle parts when the customer takes ownership of the parts. Sales returns and allowances are not significant.
Our Aviation Group revenues are recognized upon the shipment or delivery of products to customers based on when title or risk of loss transfers to the customer. Sales returns and allowances are not significant.
Substantially all of our Federal Services work is performed for our customers on a contract basis. The three primary types of contracts used are cost-type, fixed-price and time and materials. Revenues result from work performed on these contracts by our employees and our subcontractors and from costs for materials and other work related costs allowed under our contracts.
Revenues on cost-type contracts are recorded as contract allowable costs are incurred and fees are earned. Our FMS Program contract is a cost plus award fee contract. This contract has terms that specify award fee payments that are determined by performance and level of contract activity. Award fees are made during the year through a contract modification authorizing the award fee that is issued subsequent to the period in which the work is performed. We recognize award fee income on the FMS Program contract when the fees are fixed or determinable. Due to such timing and fluctuations in the level of revenues, profits as a percentage of revenues on this contract will fluctuate from period to period.
Revenue recognition methods on fixed-price contracts will vary depending on the nature of the work and the contract terms. Revenues on fixed-price service contracts are recorded as work is performed, typically ratably over the service period. Revenues on fixed-price contracts that require delivery of specific items are recorded based on a price per unit as units are delivered.
Revenues for time and materials contracts are recorded on the basis of contract allowable labor hours worked multiplied by the contract defined billing rates, plus the direct costs and indirect cost burdens associated with materials and subcontract work used in performance on the contract. Generally, profits on time and materials contracts result from the difference between the cost of services performed and the contract defined billing rates for these services.
Goodwill and Intangible Assets
Goodwill is subject to a review for impairment at least annually. We perform an annual review of goodwill for impairment during the fourth quarter and whenever events or other changes in circumstances indicate that the carrying value may not be fully recoverable. We estimate the fair value of our reporting units using a weighting of fair values derived from the income approach and market approach. Under the income approach, we calculate the fair value of a reporting unit based on the present value of estimated future cash flows. Cash flow projections are based on our estimates of revenue growth rates and operating margins, taking into consideration industry and market conditions. The discount rate used is based on a weighted average cost of capital adjusted for the relevant risk associated with the characteristics of the business and the projected cash flows.
In the fourth quarter of 2018, we performed our annual goodwill impairment analysis for each of our reporting units with goodwill. The results of the impairment analysis indicated that our reporting units had fair values substantially in excess of their carrying values with the exception of our VSE Aviation and Akimeka reporting units.
The fair value of our VSE Aviation reporting unit, within our Aviation Group, exceeded its carrying value by approximately 6%. VSE Aviation achieved its 2018 earnings projections primarily due to growth in our Singapore distribution operation. While revenues and operating income in prior years did not meet our cash flow projections, primarily due to a decreased demand for new parts and slower than anticipated development of new business opportunities, we believe that these conditions are temporary and that the overall outlook for our Aviation business remains consistent with our long-term projections. Under the income approach, we used a 13.5% discount rate (a 100 basis point increase from the discount rate used in the prior year annual analysis), a compounded annual revenue growth rate of approximately 8% over a seven-year period, and a long-term revenue growth rate of 3% in the terminal year. Our compounded annual growth rate over the seven-year period is primarily based on projected organic growth, which is corroborated by market studies related to our aviation business, and significant initiatives, including international opportunities for parts distribution and gas turbine MRO services provided to our U.S. government customer. We believe the discount rate properly reflects the risks in our future cash flows assumptions including the risk that the new business opportunities
take longer to develop or do not meet our expectations. Under the market approach, we estimated a fair value based on comparable companies' market multiples of revenues and earnings before interest, taxes, depreciation and amortization ("EBITDA") and factored in a control premium and applied such multiples to both of VSE Aviation's historical and one-year projected revenues and EBITDA. Negative changes in the key assumptions used in the annual impairment analysis or an increase in the carrying value may result in a future impairment of this reporting unit's goodwill.
Based on the results of the annual impairment analysis performed, we have determined that VSE Aviation is at risk of a future goodwill impairment if there are future declines in our cash flow projections or if we are unsuccessful in implementing our revenue growth plans. Additionally, the fair value of VSE Aviation could be adversely affected by other market factors such as an increase in the discount rate used in the income approach or a decrease in the market multiples used in the market approach, or an increase in the carrying value of this reporting unit. The carrying value of our VSE Aviation reporting unit included goodwill of approximately $104.5 million as of December 31, 2018.
The fair value of our Akimeka reporting unit, within our Federal Services Group, exceeded its carrying value by approximately 30%. Akimeka has experienced a reduction in services performed in prior years due to a decline in services ordered by clients on contracts and a loss of work performed on expiring contracts for which the follow-on work was often awarded to small businesses as set-aside contracts. These factors have been considered in the projections used in our impairment analysis. Based on the results of our analysis, our assessment is that we remain at risk of a future goodwill impairment if there is further deterioration of projected cash flows or negative changes in market factors, such as an increase in the discount rate used in the income approach or a decrease in the market multiples used in the market approach, or an increases in carrying value of this reporting unit. The carrying value of our Akimeka reporting unit included goodwill of approximately $30.9 million as of December 31, 2018.
As of December 31, 2018, we have no intangible assets with indefinite lives and we had an aggregate of approximately $199 million of goodwill associated with our acquisitions.
Results of Operations
|
| | | | | | | | | | | | | | | | | |
| Revenues (in thousands) Years ended December 31, |
| 2018 | | % | | 2017 | | % | | 2016 | | % |
Supply Chain Management Group | $ | 214,809 |
| | 30.8 | | $ | 214,542 |
| | 28.2 | | $ | 205,475 |
| | 29.7 |
Aviation Group | 145,423 |
| | 20.9 | | 134,809 |
| | 17.7 | | 133,466 |
| | 19.3 |
Federal Services Group | 336,986 |
| | 48.3 | | 410,762 |
| | 54.1 | | 352,849 |
| | 51.0 |
| $ | 697,218 |
| | 100.0 | | $ | 760,113 |
| | 100.0 | | $ | 691,790 |
| | 100.0 |
Our revenues decreased by approximately $63 million or 8% for the year ended December 31, 2018 as compared to the prior year. The change in revenues for this period resulted from a decrease in our Federal Services Group of approximately $74 million and an increase in our Aviation Group of approximately $11 million. Our Supply Chain Management Group revenues were substantially unchanged from the prior year.
Our revenues increased by approximately $68 million or 10% for the year ended December 31, 2017 as compared to the prior year. The change in revenues for this period resulted from an increase in our Federal Services Group of approximately $58 million, an increase in our Supply Chain Management Group of approximately $9 million, and an increase in our Aviation Group of approximately $1 million.
|
| | | | | | | | | | | | | | | | | | | | |
| Consolidated Statements of Income (in thousands) Years ended December 31, |
| 2018 | | % | | 2017 | | % | | 2016 | | % |
Revenues | $ | 697,218 |
| | 100.0 |
| | $ | 760,113 |
| | 100.0 |
| | $ | 691,790 |
| | 100.0 |
|
Costs and operating expenses | 644,688 |
| | 92.4 |
| | 705,788 |
| | 92.9 |
| | 640,261 |
| | 92.6 |
|
Gain on sale of contract | 1,700 |
| | 0.2 |
| | — |
| | — |
| | — |
| | — |
|
Operating income | 54,230 |
| | 7.8 |
| | 54,325 |
| | 7.1 |
| | 51,529 |
| | 7.4 |
|
Interest expense, net | 8,982 |
| | 1.3 |
| | 9,240 |
| | 1.2 |
| | 9,855 |
| | 1.4 |
|
Income before income taxes | 45,248 |
| | 6.5 |
| | 45,085 |
| | 5.9 |
| | 41,674 |
| | 6.0 |
|
Provision for income taxes | 10,168 |
| | 1.5 |
| | 5,989 |
| | 0.8 |
| | 14,881 |
| | 2.1 |
|
Net income | $ | 35,080 |
| | 5.0 |
| | $ | 39,096 |
| | 5.1 |
| | $ | 26,793 |
| | 3.9 |
|
Costs and operating expenses consist primarily of cost of inventory and delivery of our products sold; direct costs, including labor, material, and supplies used in the performance of our contract work; indirect costs associated with our direct contract costs; sales, general, and administrative expenses associated with our operating groups and corporate management; and certain costs and charges arising from nonrecurring events outside the ordinary course of business. These costs will generally increase or decrease in conjunction with our level of products sold or contract work performed. Costs and operating expenses also include expense for amortization of intangible assets acquired through our acquisitions. Expense for amortization of acquisition related intangible assets is included in the segment results in which the acquisition is included. Segment results also include expense for an allocation of corporate management costs.
Our costs and operating expenses decreased by approximately $61 million or 9% in 2018 as compared to 2017. The change in costs and operating expenses resulted primarily from a decrease in our Federal Services Group of approximately $74 million, an increase in our Supply Chain Management Group of approximately $3 million, and an increase in our Aviation Group of approximately $9 million. Costs and expenses for 2018 included approximately $569 thousand associated with our acquisition of 1st Choice Aerospace in January 2019.
Our costs and operating expenses increased by approximately $66 million or 10% in 2017 as compared to 2016. The change in costs and operating expenses resulted primarily from an increase in our Federal Services Group of approximately $52 million, an increase in our Supply Chain Management Group of approximately $10 million, and an increase in our Aviation Group of approximately $4 million.
Our operating income for 2018 was relatively unchanged as compared to 2017. Operating group results included operating income increases for our Federal Services Group of approximately $2.4 million and for our Aviation Group of approximately $1.4 million, and an operating income decrease for our Supply Chain Management Group of approximately $3.1 million. Operating income for 2018 was decreased by approximately $569 thousand due to the costs and expenses associated with our acquisition of 1st Choice Aerospace in January 2019.
Our operating income increased by approximately $2.8 million or 5% in 2017 as compared to 2016. The change in operating income resulted primarily from changes in our operating group results and settlement of two material lawsuits. Operating group results included an operating income increases for our Federal Services Group of approximately $5.6 million and an operating income decreases for our Aviation Group of approximately $3.1 million and for our Supply Chain Management Group of approximately $878 thousand. Our increase in revenue allowed us to allocate our corporate infrastructure costs over a larger revenue base, which benefited each operating group's income. The combined effect of the lawsuit settlements resulted in a decrease in operating income of approximately $1.9 million for 2016.
Interest expense decreased approximately $258 thousand in 2018 as compared to 2017 and approximately $615 thousand in 2017 as compared to 2016, primarily due to declines of our bank debt levels. Interest expense also includes interest related to our executive and administrative headquarters facility lease. The amount of interest expense associated with our headquarters financing lease is approximately $1.4 million, $1.5 million and $1.6 million for 2018, 2017 and 2016, respectively.
Provision for Income Taxes
Our effective tax rate was 22.5% for 2018, 13.3% for 2017, and 35.7% for 2016. The Tax Act passed in December 2017 resulted in a decrease to our federal tax rate for 2018 to 21% and lowered our cash tax payments for 2018. Due to the Tax Act, we
recorded a one-time reduction in our deferred tax liabilities in the fourth quarter of 2017 that resulted in a reduction in our provision for income taxes of approximately $10.6 million for the year and lowered our effective tax rate for 2017.
Our tax rate is also affected by discrete items that may occur in any given year, but may not be consistent from year to year. In addition to state income taxes, certain tax credits and other items caused differences between our statutory U.S. Federal income tax rate and our effective tax rate. Other permanent differences and federal and state tax credits such as the work opportunity tax credit and a state educational improvement tax credit provided benefit to our tax rates for 2018, 2017 and 2016.
Supply Chain Management Group Results
The results of operations for our Supply Chain Management Group are (in thousands):
|
| | | | | | | | | | | | | | | | | | | | |
| Years ended December 31, |
| 2018 | | % | | 2017 | | % | | 2016 | | % |
Revenues | $ | 214,809 |
| | 100.0 |
| | $ | 214,542 |
| | 100.0 |
| | $ | 205,475 |
| | 100.0 |
|
Costs and operating expenses | 184,183 |
| | 85.7 |
| | 180,788 |
| | 84.3 |
| | 170,843 |
| | 83.1 |
|
Operating income | $ | 30,626 |
| | 14.3 |
| | $ | 33,754 |
| | 15.7 |
| | 34,632 |
| | 16.9 |
|
Revenues for our Supply Chain Management Group were substantially unchanged for 2018, as compared to the prior year. Revenues from sales to the USPS declined approximately $4.9 million and revenues from sales to DoD and commercial customers increased approximately $5.3 million or 16%. Costs and operating expenses for our Supply Chain Management Group increased approximately $3.4 million or 2% and operating income decreased by approximately $3.1 million or 9% for 2018 as compared to the prior year. The decrease in operating income was primarily attributable to market competition and a change in the mix of products sold. The products sold associated with our increasing DoD and commercial customer revenues tend to lower our overall profit margins as our revenue mix changes.
Revenues for our Supply Chain Management Group increased approximately $9 million or 4% for 2017, as compared to the prior year. The revenue increase resulted primarily from an increase in sales to DoD and commercial customers of approximately $9.6 million or 40%. Costs and operating expenses for our Supply Chain Management Group increased approximately $10 million or 6% and operating income decreased by approximately $878 thousand or 3% for 2017 as compared to the prior year. The increase in costs and operating expenses resulted primarily from an increase in products sold.
Aviation Group Results
The results of operations for our Aviation Group are (in thousands):
|
| | | | | | | | | | | | | | | | | | | |
| Years ended December 31, |
| 2018 | | % | | 2017 | | % | | 2016 | | % |
Revenues | $ | 145,423 |
| | 100.0 |
| | 134,809 |
| | 100.0 |
| | 133,466 |
| | 100.0 |
|
Costs and operating expenses | 134,347 |
| | 92.4 |
| | 125,114 |
| | 92.8 |
| | 120,643 |
| | 90.4 |
|
Operating income | $ | 11,076 |
| | 7.6 |
| | $ | 9,695 |
| | 7.2 |
| | 12,823 |
| | 9.6 |
|
Revenues for our Aviation Group increased approximately $11 million or 8% for 2018 as compared to the prior year. The revenue increase was primarily related to sales from our Singapore distribution operation of approximately $10 million, which began generating revenue in the second quarter of 2018. Revenues from the distribution of other new parts and work on engine accessories increased and revenues from engine MRO work and the sale of serviceable parts declined. Costs and operating expenses increased by approximately $9 million or 7% and operating income increased approximately $1 million or 14% for 2018, primarily due to the revenue increase.
Revenues for our Aviation Group increased approximately $1 million or 1% for 2017 as compared to the prior year. The revenue increase was primarily related to new work from maritime gas turbine engine MRO services offset by a decrease in sales in our parts distribution business. Costs and operating expenses increased by approximately $4 million or 4% for 2017, primarily due to an increase in lower margin MRO related revenues. Costs and operating expenses for 2016 were reduced by approximately $1.3 million for a valuation adjustment to the accrued earn-out obligation associated with the acquisition of our aviation businesses in January 2015 and were increased by approximately $300 thousand due to expense associated with a settlement agreement. Our operating income decreased approximately $3 million or 24% for 2017, as compared to the prior year. Factors affecting the change in our operating income included a decrease in the demand in our parts distribution businesses, an increase in operating income from engine MRO services and engine accessories services, and the adjustments to 2016 operating income for the earn-out obligation valuation adjustment and the settlement agreement expense mentioned above.
Costs and operating expenses for this group include expense for amortization of intangible assets associated with the acquisition of our aviation businesses, allocated corporate costs, and valuation adjustments to the accrued earn-out obligation associated with the acquisition. Expense for amortization of intangible assets was approximately $6.6 million per year for 2018, 2017 and 2016. Expense for allocated corporate costs was approximately $4.2 million, $3.6 million, and $3.9 million for 2018, 2017 and 2016, respectively. Valuation adjustments to the accrued earn-out obligation decreased costs and operating expenses by approximately $1.3 million for 2016.
Federal Services Group Results
The results of operations for our Federal Group are (in thousands):
|
| | | | | | | | | | | | | | | | | | |
| Years ended December 31, |
| 2018 | | % | | 2017 | | % | | 2016 | | % |
Revenues | $ | 336,986 |
| | 100.0 |
| | 410,762 |
| | 100.0 |
| | 352,849 |
| | 100.0 |
|
Costs and operating expenses | 322,889 |
| | 95.8 |
| | 397,343 |
| | 96.7 |
| | 345,053 |
| | 97.8 |
|
Gain on sale of contract | 1,700 |
| | 0.5 |
| | — |
| | — |
| | — |
| | — |
|
Operating income | $ | 15,797 |
| | 4.7 |
| | 13,419 |
| | 3.3 |
| | 7,796 |
| | 2.2 |
|
Revenues for our Federal Services Group decreased approximately $74 million or 18% and costs and operating expenses decreased approximately $74 million or 19% for 2018, as compared to the prior year. Revenues for this group increased approximately $58 million or 16% and costs and operating expenses increased approximately $52 million or 15% for 2017, as compared to the prior year.
Significant items affecting changes in our revenues and costs and operating expenses for 2018 included a decrease of approximately $36 million in revenues on our FMS Program, a net decrease in revenues of approximately $21 million on two U.S. Army contracts that were completed in 2017, and decreased revenues of approximately $16 million on our RRAD ERS Program related to a decreased level of work required on the program. These decreases were partially offset by increased revenues of approximately $5 million on our CFT Program work, $4 million on our U.S. Army Reserve vehicle refurbishment work, and changes in the level of work on various other programs and contracts.
Gain on sale of contract is comprised of $1.7 million associated with the sale of an indefinite-delivery/indefinite-quantity government-wide acquisition contract with NIH in the third quarter of 2018.
Operating income increased by approximately $2.4 million or 18% for 2018, compared to the prior year. Significant items affecting changes in our operating income included a gain of $1.7 million on the sale of the NIH contract, a loss recorded in 2017 of approximately $1.9 million on a Department of Energy contract that did not continue into 2018, and a decrease in fees earned on our FMS Program work of approximately $1 million.
Significant items affecting changes in our revenues and costs and operating expenses for 2017 included an increase in revenue of approximately $25 million from the inclusion of a full year of revenue on our RRAD ERS Program in 2017 as compared to a partial year in 2016, an increase in revenue of approximately $16 million from our FMS Program services, an increase in revenue of approximately $3 million from our Ft. Benning Logistics Support Services Program, and increases in work and new work on various other contracts.
Operating income increased by approximately $5.6 million or 72% for 2017, as compared to 2016. The increase in operating income resulted primarily from an increase of award fees earned on our FMS Program of approximately $1.9 million; from an improvement in profit margins on vehicle and equipment refurbishment, maintenance, and sustainment work supporting various U.S. Army and Army Reserve programs; and from increases in revenues resulting in a more favorable cost structure relative to the increased revenue levels. Operating income for 2017 was adversely affected by a contract related loss for our Energetics subsidiary of approximately $1.9 million.
Financial Condition
There has been no material change in our financial condition in 2018. Changes to asset and liability accounts were due primarily to our earnings, our level of business activity, the timing of inventory purchases, contract delivery schedules, subcontractor and vendor payments required to perform our contract work, and the timing of associated billings to and collections from our customers. In January 2018, we amended our bank loan agreement to extend the maturity date, increase the amount of bank loan commitments available to us, implement a more favorable interest rate structure, and modify other terms and conditions.
Liquidity and Capital Resources
Cash Flows
Cash and cash equivalents decreased by approximately $462 thousand during 2018
Cash provided by operating activities decreased by approximately $31.6 million in 2018 as compared to 2017. The change was attributable to a decrease of approximately $4.0 million in cash provided by net income, an increase of approximately $6.7 million in other non-cash operating activities and a decrease of approximately $34.3 million due to changes in the levels of operating assets and liabilities.
Our inventories and accounts receivable represent a significant amount of our assets, and our accounts payable represent a significant amount of our operating liabilities. Cash used related to increases in inventory was approximately $35.6 million, cash provided by decreases in receivables and unbilled receivables were approximately $952 thousand, and cash used related to decreases in accounts payable and deferred compensation was approximately $7.4 million for 2018. A significant portion of our accounts receivable and accounts payable result from the use of subcontractors to perform work on our contracts and from the purchase of materials to fulfill our contract obligations. Accordingly, our levels of accounts receivable and accounts payable may fluctuate depending on the timing of services ordered and products sold, government funding delays, the timing of billings received from subcontractors and materials vendors, and the timing of payments received for services. Such timing differences have the potential to cause significant increases and decreases in our inventory, accounts receivable, and accounts payable in short time periods, and accordingly, can cause increases or decreases in our cash provided by operations.
Cash used in investing activities decreased approximately $1.7 million in 2018 as compared to 2017. Cash used in investing activities consisted primarily of purchases of property and equipment and proceeds from the sale of a contract.
Cash used in financing activities decreased approximately $29.2 million in 2018 as compared to 2017. Cash used in financing activities consisted primarily of net repayments of our bank loan borrowings.
Cash provided by operating activities increased by approximately $3.2 million in 2017 as compared to 2016. The change was attributable to an increase of approximately $12.3 million in cash provided by net income, a decrease of approximately $7.3 million in depreciation and amortization and other non-cash operating activities, and a decrease of approximately $1.8 million due to changes in the levels of operating assets and liabilities. Net income was increased and non-cash operating activities were decreased by approximately $10.6 million due to an adjustment to deferred tax liabilities arising from the enactment of the Tax Act in December 2017.
Cash used in investing activities decreased approximately $3.5 million in 2017 as compared to 2016. Cash used in investing activities consisted primarily of purchases of property and equipment.
Cash used in financing activities increased approximately $6.2 million in 2017 as compared to 2016. Cash used in financing activities consisted primarily of net repayments of our bank loan borrowings. We used approximately $19 million in 2016 for payment of our final earn-out obligation associated with the 2015 acquisition of our aviation businesses.
We paid cash dividends totaling approximately $3.3 million or $0.30 per share during 2018. Pursuant to our bank loan agreement, our payment of cash dividends is subject to annual restrictions. We have paid cash dividends each year since 1973 and have increased our dividend each year since 2004.
Liquidity
Our internal sources of liquidity are primarily from operating activities, specifically from changes in our level of revenues and associated inventory, accounts receivable and accounts payable, and from profitability. Significant increases or decreases in revenues and inventory, accounts receivable and accounts payable can affect our liquidity. Our inventory and accounts payable levels can be affected by the timing of large opportunistic inventory purchases. Our accounts receivable and accounts payable levels can be affected by changes in the level of contract work we perform, by the timing of large materials purchases and subcontractor efforts used in our contracts, and by delays in the award of contractual coverage and funding and payments. Government funding delays can cause delays in our ability to invoice for revenues earned, presenting a potential negative impact on our days sales outstanding.
We also purchase property and equipment; invest in expansion, improvement, and maintenance of our operational and administrative facilities; and invest in the acquisition of other companies.
Our external financing consists of a loan agreement with a bank group that provides for a term loan, revolving loans and letters of credit. The loan agreement, which was amended in January 2018 and expires in January 2023, has a term loan facility and a revolving loan facility. The revolving loan facility provides for revolving loans and letters of credit.
The term loan requires quarterly installment payments. Our required term loan payments after December 31, 2018 are approximately $10.0 million in 2019, $11.9 million in 2020, $14.4 million in 2021, $15.0 million in 2022, and $29.5 million in 2023. The amount of term loan borrowings outstanding as of December 31, 2018 was $80.8 million.
The maximum amount of credit available to us under the loan agreement for revolving loans and letters of credit as of December 31, 2018 was $300 million. We pay an unused commitment fee and fees on letters of credit that are issued. We had approximately $81.9 million in revolving loan amounts outstanding and $57 thousand of letters of credit outstanding as of December 31, 2018. We had approximately $79.3 million in revolving loan amounts outstanding and no letters of credit outstanding as of December 31, 2017.
Under the loan agreement we may elect to increase the maximum availability of the term loan facility, the revolving loan facility, or a combination of both facilities. The aggregate limit of incremental increases is $100 million.
Total bank loan borrowed funds outstanding, including term loan borrowings and revolving loan borrowings, were approximately $162.7 million and $173.7 million as of December 31, 2018 and 2017, respectively. These amounts exclude unamortized deferred financing costs of approximately $2.1 million and $1.1 million as of December 31, 2018 and 2017, respectively. The fair value of outstanding debt under our bank loan facilities as of December 31, 2018 approximates its carrying value using Level 2 inputs based on market data on companies with a corporate rating similar to ours that have recently priced credit facilities.
We pay interest on the term loan borrowings and revolving loan borrowings at LIBOR plus a base margin or at a base rate (typically the prime rate) plus a base margin. As of December 31, 2018, the LIBOR base margin was 1.75% and the base rate
base margin was 0.50%. The base margins increase or decrease in increments as our Total Funded Debt/EBITDA Ratio increases or decreases.
The loan agreement requires us to have interest rate hedges on a portion of the outstanding term loan for the first three years after the date of the amendment. We have executed compliant interest rate hedges. The amount of swapped debt outstanding as of December 31, 2018 was $50 million.
After taking into account the impact of hedging instruments, as of December 31, 2018, interest rates on portions of our outstanding debt ranged from 3.00% to 6.00%, and the effective interest rate on our aggregate outstanding debt was 4.17%.
Interest expense incurred on bank loan borrowings and interest rate hedges was approximately $6.9 million, $7.2 million and $7.8 million during the years ended December 31, 2018, 2017 and 2016, respectively.
The loan agreement contains collateral requirements to secure our loan agreement obligations, restrictive covenants, a limit on annual dividends, and other affirmative and negative covenants, conditions and limitations. Restrictive covenants include a maximum Total Funded Debt/EBITDA Ratio of 3.0 to 1.0, with a provision to increase the maximum ratio in the event of a material acquisition, and minimum Fixed Charge Coverage Ratio of 1.20 to 1.0. We were in compliance with required ratios and other terms and conditions as of December 31, 2018.
|
| | |
| Maximum Ratio | Actual Ratio |
Total Funded Debt/EBITDA Ratio | 3.00 to 1 | 1.89 to 1 |
|
| | |
| Minimum Ratio | Actual Ratio |
Fixed Charge Coverage Ratio | 1.20 to 1 | 3.78 to 1 |
We currently do not use public debt security financing.
Contractual Obligations
Our contractual obligations as of December 31, 2018 are (in thousands):
|
| | | | | | | | | | | | | | | | | | | | |
| | Payments Due by Period |
Contractual Obligations | | Total | | Less than 1 year | | 1-3 years | | 4-5 years | | After 5 years |
Bank loan debt | | $ | 162,734 |
| | $ | 10,000 |
| | $ | 26,250 |
| | $ | 126,484 |
| | $ | — |
|
Operating leases, net of non-cancelable sublease income | | 7,530 |
| | 2,527 |
| | 2,749 |
| | 2,087 |
| | 167 |
|
Corporate headquarters lease, net of non-cancelable sublease income | | 40,527 |
| | 4,080 |
| | 9,284 |
| | 9,775 |
| | 17,388 |
|
Purchase obligations | | 162 |
| | 155 |
| | 7 |
| | — |
| | — |
|
Total | | $ | 210,953 |
| | $ | 16,762 |
| | $ | 38,290 |
| | $ | 138,346 |
| | $ | 17,555 |
|
Estimated cash requirements for interest on our bank loan debt are approximately $12.0 million for 2019 and $9.9 million for 2020.
Inflation and Pricing
Most of our contracts provide for estimates of future labor costs to be escalated for any option periods, while the non-labor costs in our contracts are normally considered reimbursable at cost. Our property and equipment consists principally of land, buildings and improvements, shop and warehouse equipment, computer systems equipment, and furniture and fixtures. We do not expect the overall impact of inflation on replacement costs of our property and equipment to be material to our future results of operations or financial condition.
ITEM 7A. Quantitative and Qualitative Disclosures About Market Risks
Interest Rates
Our bank loan agreement provides available borrowing to us at variable interest rates. Accordingly, future interest rate changes could potentially put us at risk for a material adverse impact on future earnings and cash flows. To mitigate the risks associated with future interest rate movements we have employed interest rate hedges to fix the rate on a portion of our outstanding borrowings for various periods. The resulting fixed rates on this portion of our debt give us protection against interest rate increases.
In February 2015, we entered into a LIBOR based interest rate swap on our term loan for a term of four years with a notional amount of $100 million. The swap amount on our term loan decreases in increments on an annual basis. As of December 31, 2018, the amount of the term loan swap was $40 million and with the term loan swap in place, we pay an effective interest rate of 1.25% plus our base margin. In February 2018, we entered into a LIBOR based interest rate swap on our term loan for a term of three years with a notional amount of $10 million for the first year and increasing to $50 million for the second and third years, for which we pay an effective interest rate of 2.54% plus our base margin. In February 2019, we entered into a LIBOR based interest rate swap on our revolving loan for a term of three years with a notional amount of $75 million for the first year, decreasing to $45 million for the second year and $25 million for the third year, for which we pay an effective interest rate of 2.805% plus our base margin.
ITEM 8. Financial Statements and Supplementary Data
|
| |
Index to Financial Statements |
| |
| Page |
| |
| |
| |
| |
| |
| |
| |
| |
Report of Independent Registered Public Accounting Firm
The Board of Directors and Stockholders of VSE Corporation
Opinion on the Financial Statements
We have audited the accompanying consolidated balance sheets of VSE Corporation and Subsidiaries (the Company) as of December 31, 2018 and 2017, the related consolidated statements of income, comprehensive income, stockholders' equity and cash flows for each of the three years in the period ended December 31, 2018, and the related notes (collectively referred to as the “consolidated financial statements”). In our opinion, the consolidated financial statements present fairly, in all material respects, the financial position of the Company at December 31, 2018 and 2017, and the results of its operations and its cash flows for each of the three years in the period ended December 31, 2018, in conformity with U.S. generally accepted accounting principles.
We also have audited, in accordance with the standards of the Public Company Accounting Oversight Board (United States) (PCAOB), the Company’s internal control over financial reporting as of December 31, 2018, based on criteria established in Internal Control-Integrated Framework issued by the Committee of Sponsoring Organizations of the Treadway Commission (2013 framework) and our report dated March 6, 2019 expressed an unqualified opinion thereon.
Adoption of Accounting Standards Update (ASU) No. 2014-09, Revenue from Contracts with Customers (Topic 606)
As discussed in Note 1 to the consolidated financial statements, the Company changed its method of accounting for revenue in 2018 due to the adoption of Accounting Standards Update (ASU) No. 2014-09, Revenue from Contracts with Customers (Topic 606), and the related amendments.
Basis for Opinion
These financial statements are the responsibility of the Company’s management. Our responsibility is to express an opinion on the Company’s financial statements based on our audits. We are a public accounting firm registered with the PCAOB and are required to be independent with respect to the Company in accordance with the U.S. federal securities laws and the applicable rules and regulations of the Securities and Exchange Commission and the PCAOB.
We conducted our audits in accordance with the standards of the PCAOB. Those standards require that we plan and perform the audit to obtain reasonable assurance about whether the financial statements are free of material misstatement, whether due to error or fraud. Our audits included performing procedures to assess the risks of material misstatement of the financial statements, whether due to error or fraud, and performing procedures that respond to those risks. Such procedures included examining, on a test basis, evidence regarding the amounts and disclosures in the financial statements. Our audits also included evaluating the accounting principles used and significant estimates made by management, as well as evaluating the overall presentation of the financial statements. We believe that our audits provide a reasonable basis for our opinion.
/s/ Ernst & Young LLP
We have served as the Company’s auditor since 2002.
|
| |
Tysons, Virginia | |
March 6, 2019 | |
VSE Corporation and Subsidiaries
Consolidated Balance Sheets
(in thousands, except share and per share amounts)
|
| | | | | | | |
| As of December 31, |
| 2018 | | 2017 |
Assets | | | |
Current assets: | | | |
Cash and cash equivalents | $ | 162 |
| | $ | 624 |
|
Receivables, net | 60,004 |
| | 55,760 |
|
Unbilled receivables, net | 41,255 |
| | 42,577 |
|
Inventories, net | 166,392 |
| | 132,591 |
|
Other current assets | 13,407 |
| | 16,988 |
|
Total current assets | 281,220 |
| | 248,540 |
|
| | | |
Property and equipment, net | 49,606 |
| | 55,146 |
|
Intangible assets, net | 94,892 |
| | 110,909 |
|
Goodwill | 198,622 |
| | 198,622 |
|
Other assets | 14,488 |
| | 15,796 |
|
Total assets | $ | 638,828 |
| | $ | 629,013 |
|
| | | |
Liabilities and Stockholders' equity | |
| | |
|
Current liabilities: | |
| | |
|
Current portion of long-term debt | $ | 9,466 |
| | $ | 6,960 |
|
Accounts payable | 57,408 |
| | 66,015 |
|
Accrued expenses and other current liabilities | 37,133 |
| | 40,243 |
|
Dividends payable | 871 |
| | 759 |
|
Total current liabilities | 104,878 |
| | 113,977 |
|
| | | |
Long-term debt, less current portion | 151,133 |
| | 165,614 |
|
Deferred compensation | 17,027 |
| | 16,323 |
|
Long-term lease obligations, less current portion | 18,913 |
| | 20,581 |
|
Deferred tax liabilities | 18,482 |
| | 19,423 |
|
Total liabilities | 310,433 |
| | 335,918 |
|
| | | |
Commitments and contingencies |
|
| |
|
|
| | | |
Stockholders' equity: | |
| | |
|
Common stock, par value $0.05 per share, authorized 15,000,000 shares; issued and outstanding 10,886,036 and 10,838,747 respectively | 544 |
| | 542 |
|
Additional paid-in capital | 26,632 |
| | 24,470 |
|
Retained earnings | 301,073 |
| | 267,902 |
|
Accumulated other comprehensive income | 146 |
| | 181 |
|
Total stockholders' equity | 328,395 |
| | 293,095 |
|
Total liabilities and stockholders' equity | $ | 638,828 |
| | $ | 629,013 |
|
The accompanying notes are an integral part of these financial statements.
VSE Corporation and Subsidiaries
Consolidated Statements of Income
(in thousands, except share and per share amounts)
|
| | | | | | | | | | | |
| For the years ended December 31, |
| 2018 | | 2017 | | 2016 |
Revenues: | | | | | |
Products | $ | 360,505 |
| | $ | 350,129 |
| | $ | 341,776 |
|
Services | 336,713 |
| | 409,984 |
| | 350,014 |
|
Total revenues | 697,218 |
| | 760,113 |
| | 691,790 |
|
| | | | | |
Costs and operating expenses: | |
| | |
| | |
|
Products | 303,881 |
| | 291,769 |
| | 279,629 |
|
Services | 321,076 |
| | 395,573 |
| | 337,956 |
|
Selling, general and administrative expenses | 3,714 |
| | 2,429 |
| | 6,609 |
|
Amortization of intangible assets | 16,017 |
| | 16,017 |
| | 16,067 |
|
Total costs and operating expenses | 644,688 |
| | 705,788 |
| | 640,261 |
|
| | | | | |
Gain on sale of contract | 1,700 |
| | — |
| | — |
|
| | | | | |
Operating income | 54,230 |
| | 54,325 |
| | 51,529 |
|
| | | | | |
Interest expense, net | 8,982 |
| | 9,240 |
| | 9,855 |
|
| | | | | |
Income before income taxes | 45,248 |
| | 45,085 |
| | 41,674 |
|
| | | | | |
Provision for income taxes | 10,168 |
| | 5,989 |
| | 14,881 |
|
| | | | | |
Net income | $ | 35,080 |
| | $ | 39,096 |
| | $ | 26,793 |
|
| | | | | |
Basic earnings per share: | $ | 3.23 |
| | $ | 3.61 |
| | $ | 2.48 |
|
| | | | | |
Basic weighted average shares outstanding | 10,876,201 |
| | 10,834,562 |
| | 10,793,723 |
|
| | | | | |
Diluted earnings per share: | $ | 3.21 |
| | $ | 3.60 |
| | $ | 2.47 |
|
| | | | | |
Diluted weighted average shares outstanding | 10,936,057 |
| | 10,867,834 |
| | 10,828,152 |
|
The accompanying notes are an integral part of these financial statements.
VSE Corporation and Subsidiaries
Consolidated Statements of Comprehensive Income
(in thousands)
|
| | | | | | | | | | | |
| For the years ended December 31, |
| 2018 | | 2017 | | 2016 |
| | | | | |
Net income | $ | 35,080 |
| | $ | 39,096 |
| | $ | 26,793 |
|
Change in fair value of interest rate swap agreements, net of tax | (35 | ) | | 136 |
| | 120 |
|
Other comprehensive income (loss), net of tax | (35 | ) | | 136 |
| | 120 |
|
Comprehensive income | $ | 35,045 |
| | $ | 39,232 |
| | $ | 26,913 |
|
The accompanying notes are an integral part of these financial statements.
VSE Corporation and Subsidiaries
Consolidated Statements of Stockholders' Equity
(in thousands except per share data)
|
| | | | | | | | | | | | | | | | | | | | | | |
| | | | | Additional Paid-In Capital | | Retained Earnings | | Accumulated Other Comprehensive Income (Loss) | | Total Stockholders' Equity |
| Common Stock | | | | |
| Shares | | Amount | | | | |
Balance at December 31, 2015 | 10,751 |
| | $ | 538 |
| | $ | 21,368 |
| | $ | 207,478 |
| | $ | (75 | ) | | $ | 229,309 |
|
Net income | — |
| | — |
| | — |
| | 26,793 |
| | — |
| | 26,793 |
|
Stock-based compensation | 48 |
| | 2 |
| | 1,508 |
| | — |
| | — |
| | 1,510 |
|
Change in fair value of interest rate swap agreements, net of tax | — |
| | — |
| | — |
| | — |
| | 120 |
| | 120 |
|
Dividends declared ($0.235 per share) | — |
| | — |
| | — |
| | (2,538 | ) | | — |
| | (2,538 | ) |
Balance at December 31, 2016 | 10,799 |
| | 540 |
| | 22,876 |
| | 231,733 |
| | 45 |
| | 255,194 |
|
Net income | — |
| | — |
| | — |
| | 39,096 |
| | — |
| | 39,096 |
|
Stock-based compensation | 40 |
| | 2 |
| | 1,594 |
| | — |
| | — |
| | 1,596 |
|
Change in fair value of interest rate swap agreements, net of tax | — |
| | — |
| | — |
| | — |
| | 136 |
| | 136 |
|
Dividends declared ($0.27 per share) | — |
| | — |
| | — |
| | (2,927 | ) | | — |
| | (2,927 | ) |
Balance at December 31, 2017 | 10,839 |
| | 542 |
| | 24,470 |
| | 267,902 |
| | 181 |
| | 293,095 |
|
Cumulative effect of adoption of ASU 2014-09, net of tax | — |
| | — |
| | — |
| | 1,465 |
| | — |
| | 1,465 |
|
Net income | — |
| | — |
| | — |
| | 35,080 |
| | — |
| | 35,080 |
|
Stock-based compensation | 47 |
| | 2 |
| | 2,162 |
| | — |
| | — |
| | 2,164 |
|
Change in fair value of interest rate swap agreements, net of tax | — |
| | — |
| | — |
| | — |
| | (35 | ) | | (35 | ) |
Dividends declared ($0.31 per share) | — |
| | — |
| | — |
| | (3,374 | ) | | — |
| | (3,374 | ) |
Balance at December 31, 2018 | 10,886 |
| | $ | 544 |
| | $ | 26,632 |
| | $ | 301,073 |
| | $ | 146 |
| | $ | 328,395 |
|
The accompanying notes are an integral part of these financial statements.
VSE Corporation and Subsidiaries
Consolidated Statements of Cash Flows
(in thousands)
|
| | | | | | | | | | | |
| For the years ended December 31, |
| 2018 | | 2017 | | 2016 |
Cash flows from operating activities: | | | | | |
Net income | $ | 35,080 |
| | $ | 39,096 |
| | $ | 26,793 |
|
Adjustments to reconcile net income to net cash provided by operating activities: | |
| | |
| | |
|
Depreciation and amortization | 25,224 |
| | 25,882 |
| | 26,046 |
|
Deferred taxes | (1,371 | ) | | (10,534 | ) | | (1,146 | ) |
Stock-based compensation | 3,027 |
| | 3,068 |
| | 2,109 |
|
Gain on sale of contract | (1,700 | ) | | — |
| | — |
|
Earn-out obligation adjustment | — |
| | — |
| | (1,329 | ) |
Changes in operating assets and liabilities, net of impact of acquisitions: | |
| | |
| | |
|
Receivables, net | (3,754 | ) | | (91 | ) | | (12,166 | ) |
Unbilled receivables, net | 4,706 |
| | 2,972 |
| | (10,581 | ) |
Inventories, net | (35,558 | ) | | 3,749 |
| | (27,217 | ) |
Other current assets and noncurrent assets | 4,789 |
| | 3,681 |
| | (13,020 | ) |
Accounts payable and deferred compensation | (7,405 | ) | | (23,587 | ) | | 54,743 |
|
Accrued expenses and other current liabilities | (2,515 | ) | | 7,562 |
| | 4,253 |
|
Long-term lease obligations | (1,668 | ) | | (1,378 | ) | | (1,292 | ) |
| | | | | |
Net cash provided by operating activities | 18,855 |
| | 50,420 |
| | 47,193 |
|
| | | | | |
Cash flows from investing activities: | |
| | |
| | |
|
Purchases of property and equipment | (3,117 | ) | | (3,743 | ) | | (6,546 | ) |
Proceeds from the sale of property and equipment | 122 |
| | 732 |
| | 143 |
|
Proceeds from the sale of contract | 1,700 |
| | — |
| | — |
|
Cash paid for acquisitions, net of cash acquired | — |
| | — |
| | (63 | ) |
| | | | | |
Net cash used in investing activities | (1,295 | ) | | (3,011 | ) | | (6,466 | ) |
| | | | | |
Cash flows from financing activities: | |
| | |
| | |
|
Borrowings on loan agreement | 539,471 |
| | 348,675 |
| | 321,630 |
|
Repayments on loan agreement | (550,436 | ) | | (391,285 | ) | | (340,046 | ) |
Earn-out obligation payments | — |
| | — |
| | (18,515 | ) |
Payment of debt financing costs | (1,702 | ) | | — |
| | — |
|
Payments on financing lease obligations | (1,452 | ) | | (1,287 | ) | | (1,128 | ) |
Payment of taxes for equity transactions | (641 | ) | | (500 | ) | | (499 | ) |
Dividends paid | (3,262 | ) | | (2,816 | ) | | (2,481 | ) |
| | | | | |
Net cash used in by financing activities | (18,022 | ) | | (47,213 | ) | | (41,039 | ) |
| | | | | |
| | | | | |
Net (decrease) increase in cash and cash equivalents | (462 | ) | | 196 |
| | (312 | ) |
Cash and cash equivalents at beginning of year | 624 |
| | 428 |
| | 740 |
|
Cash and cash equivalents at end of year | $ | 162 |
| | $ | 624 |
| | $ | 428 |
|
|
| | | | | | | | | | | |
Supplemental cash flow disclosures: | | | | | |
| | | | | |
Cash paid for: | | | | | |
Interest | $ | 7,523 |
| | $ | 7,606 |
| | $ | 8,230 |
|
Income taxes | $ | 9,534 |
| | $ | 16,346 |
| | $ | 18,886 |
|
The accompanying notes are an integral part of these financial statements.
VSE Corporation and Subsidiaries
Notes to Consolidated Financial Statements
December 31, 2018
(1) Nature of Business and Significant Accounting Policies
Nature of Business
The term "VSE," the "Company," "us," "we," or "our" means VSE and its subsidiaries and divisions unless the context indicates operations of only VSE as the parent company.
Our operations include supply chain management solutions and parts supply for vehicle fleets; maintenance, repair, and overhaul ("MRO") services and parts supply for aviation clients; vehicle and equipment maintenance and refurbishment; logistics; engineering; energy services; IT and health care IT solutions; and consulting services. We provide logistics services for legacy systems and equipment and professional and technical services to the United States Government (the "government"), including the United States Postal Service ("USPS"), the United States Department of Defense ("DoD") and federal civilian agencies and to commercial customers, and to other customers.
Principles of Consolidation
The consolidated financial statements consist of the operations of our parent company, our wholly owned subsidiaries, Energetics Incorporated ("Energetics"), Akimeka, LLC ("Akimeka"), Wheeler Bros., Inc. ("WBI") and VSE Aviation, Inc. ("VSE Aviation"), and our unincorporated divisions. All intercompany transactions have been eliminated in consolidation.
Use of Estimates in the Preparation of Financial Statements
The preparation of financial statements in conformity with accounting principles generally accepted in the United States requires us to make estimates and assumptions that affect the reported amounts of assets and liabilities and disclosure of contingent assets and liabilities at the date of the financial statements and the reported amounts of revenues and expenses during the reporting period. Actual results could differ from those estimates. Significant estimates affecting the financial statements include accruals for contract disallowance reserves and recoverability of goodwill and intangible assets.
Recently Adopted Accounting Pronouncements
In May 2014, the FASB issued ASU No. 2014-09, Revenue from Contracts with Customers (Topic 606) and related amendments ("ASC 606"), which outlines a single comprehensive model for entities to use in accounting for revenue arising from contracts with customers and supersedes most current revenue recognition guidance, including industry-specific guidance. ASC 606 is based on the principle that an entity should recognize revenue to depict the transfer of goods or services to customers in an amount that reflects the consideration to which the entity expects to be entitled in exchange for the goods or services. ASC 606 also requires additional disclosure about the nature, amount, timing and uncertainty of revenue and cash flows arising from customer contracts, including significant judgments and changes in judgments and assets recognized from costs incurred to fulfill a contract.
On January 1, 2018, we adopted ASC 606 using the modified retrospective method applied to those contracts which were not completed as of January 1, 2018, including the aggregate effect of modifications to such contracts through January 1, 2018. Results for reporting periods beginning after January 1, 2018 are presented under the new guidance, while prior period amounts are not adjusted and continue to be reported in accordance with previous guidance. We recognized the cumulative effect of initially applying the new standard through an increase to the opening balance of retained earnings of approximately $1.5 million. The primary effects of adopting ASC 606 are: (1) the timing of when we recognize revenue on our contracts with award fees, which previously was based on when we received customer authorization, changed to recognition of the award fees to the extent that it is probable that a significant reversal will not occur as the related performance obligation is satisfied, resulting in revenue being recognized earlier in the contract period, (2) the timing of when we recognize revenues and costs on maintenance, repair and overhaul ("MRO") services for aviation clients and certain fixed price delivery contracts, which changed from the date of delivery to recognition over time as control of the good or service transfers to the customer and progress is made to satisfy the performance obligation, and (3) the pattern in which we recognize revenue on certain fixed price services contracts changed from a straight-line basis over the contract period to measuring progress using input measures, such as costs incurred. The comparative information has not been restated and continues to be reported under the accounting standards in effect for those periods.
The adoption of ASC 606 also resulted in the establishment of “Unbilled receivables, net” as a separate line item on our consolidated balance sheets and reclassification of balances to this new line item from “Receivables, net.” Certain prior year
amounts have been reclassified to conform to the current year presentation. These reclassifications have no effect on our reported financial condition, results of operations, or cash flows.
The cumulative effect of the changes made to our opening consolidated balance sheet for the adoption of the ASC 606 was as follows (in thousands):
|
| | | | | | | | | | | | |
| | Balance at | | Adjustment for | | Adjusted balance at |
| | December 31, 2017 | | ASC 606 | | January 1, 2018 |
Assets: | | | | | | |
Receivables, net | | $ | 55,760 |
| | $ | 490 |
| | $ | 56,250 |
|
Unbilled receivables, net | | $ | 42,577 |
| | $ | 3,384 |
| | $ | 45,961 |
|
Inventories, net | | $ | 132,591 |
| | $ | (1,757 | ) | | $ | 130,834 |
|
| | | | | | |
Liabilities: | | | | | | |
Accounts payable | | $ | 66,015 |
| | $ | (498 | ) | | $ | 65,517 |
|
Accrued expenses and other current liabilities | | $ | 40,243 |
| | $ | 655 |
| | $ | 40,898 |
|
Deferred tax liabilities | | $ | 19,423 |
| | $ | 495 |
| | $ | 19,918 |
|
| | | | | | |
Stockholders’ equity: | | | | | | |
Retained earnings | | $ | 267,902 |
| | $ | 1,465 |
| | $ | 269,367 |
|
In accordance with the new revenue standard requirements for entities adopting ASC 606 using the modified retrospective method, the disclosure of the impact of adoption on certain line items in our consolidated balance sheet as of December 31, 2018 and statements of income and cash flows for the year ended December 31, 2018 was as follows (in thousands):
Balance Sheet
|
| | | | | | | | |
| | As Reported | | Without Adoption of ASC 606 |
Assets: | | | | |
Unbilled receivables, net | | $ | 41,255 |
| | $ | 36,451 |
|
Inventories, net | | $ | 166,392 |
| | $ | 169,673 |
|
| | | | |
Liabilities: | | | | |
Accrued expenses and other current liabilities | | $ | 37,133 |
| | $ | 37,133 |
|
Deferred tax liabilities | | $ | 18,482 |
| | $ | 18,097 |
|
| | | | |
Stockholders’ equity: | | | | |
Retained earnings | | $ | 301,073 |
| | $ | 299,936 |
|
Statement of Income |
| | | | | | | | |
| | As Reported | | Without Adoption of ASC 606 |
Revenues: | | | | |
Products | | $ | 360,505 |
| | $ | 358,496 |
|
Services | | $ | 336,713 |
| | $ | 337,635 |
|
| | | | |
Costs and operating expenses: | | | | |
Products | | $ | 303,881 |
| | $ | 302,356 |
|
Services | | $ | 321,076 |
| | $ | 321,076 |
|
| | | | |
Provision for income taxes | | $ | 10,168 |
| | $ | 10,281 |
|
| | | | |
Net income | | $ | 35,080 |
| | $ | 35,406 |
|
Statement of Cash Flows
|
| | | | | | |
| | As Reported | | Without Adoption of ASC 606 |
Net income | | 35,080 |
| | 35,406 |
|
Deferred taxes | | (1,371 | ) | | (1,260 | ) |
Receivables,net | | (3,754 | ) | | (4,244 | ) |
Unbilled receivables, net | | 4,706 |
| | 6,126 |
|
Inventories, net | | (35,558 | ) | | (37,082 | ) |
Accounts payable and deferred compensation | | (7,405 | ) | | (7,903 | ) |
Accrued expenses and other current liabilities | | (2,515 | ) | | (1,860 | ) |
Net cash provided by operating activities | | 18,855 |
| | 18,855 |
|
Stock-Based Compensation
We account for share-based awards in accordance with the applicable accounting rules that require the measurement and recognition of compensation expense for all share-based payment awards based on estimated fair values. The compensation expense included in costs and operating expenses is amortized over the requisite service period using the accelerated attribution method.
Earnings Per Share
Basic earnings per share ("EPS") is computed by dividing net income by the weighted average number of shares of common stock outstanding during each period. Shares issued during the period are weighted for the portion of the period that they were outstanding. Our calculation of diluted earnings per common share includes the dilutive effects for the assumed vesting of restricted stock awards.
|
| | | | | | | | |
| Years Ended December 31, |
| 2018 | | 2017 | | 2016 |
Basic weighted average common shares outstanding | 10,876,201 |
| | 10,834,562 |
| | 10,793,723 |
|
Effect of dilutive shares | 59,856 |
| | 33,272 |
| | 34,429 |
|
Diluted weighted average common shares outstanding | 10,936,057 |
| | 10,867,834 |
| | 10,828,152 |
|
Cash and Cash Equivalents
We consider all highly liquid investments with an original maturity of three months or less to be cash equivalents. Due to the short maturity of these instruments, the carrying values on our consolidated balance sheets approximate fair value.
Property and Equipment
Property and equipment are recorded at cost. Depreciation of computer equipment, furniture, other equipment is provided principally by the straight-line method over periods of three to 15 years. Depreciation of buildings and land improvements is provided by the straight-line method over periods of approximately 15 to 20 years. Amortization of leasehold improvements is provided by the straight-line method over the lesser of their useful life or the remaining term of the lease.
Concentration of Credit Risk/Fair Value of Financial Instruments
Financial instruments that potentially subject us to concentration of credit risk consist primarily of cash, cash equivalents and trade receivables. Contracts with the government, either as a prime or subcontractor, accounted for approximately 78%, 82%, and 80% of revenues for the years ended December 31, 2018, 2017 and 2016, respectively. We believe that concentrations of credit risk with respect to trade receivables are limited as they are primarily government receivables. We believe that the fair market value of all financial instruments, including debt, approximate book value.
Revenues for 2018
We account for revenue in accordance with ASC 606. The unit of account in ASC 606 is a performance obligation. At the inception of each contract with a customer, we determine our performance obligations under the contract and the contract's transaction price. A performance obligation is a promise in a contract to transfer a distinct good or service to the customer, and is defined as the unit of account. A contract’s transaction price is allocated to each distinct performance obligation and recognized as revenue when the performance obligation is satisfied. The majority of our contracts have a single performance obligation as the promise to transfer the respective goods or services is not separately identifiable from other promises in the contracts and is, therefore, not distinct. For product sales, each product sold to a customer typically represents a distinct performance obligation. Our performance obligations are satisfied over time as work progresses or at a point in time based on transfer of control of products and services to our customers.
Contract modifications are routine in the performance of our contracts. Contracts are often modified to account for changes in contract specifications or requirements. In most instances, contract modifications are for goods or services that are not distinct, and therefore are accounted for as part of the existing contract.
Substantially all of our Supply Chain Management Group revenues from the sale of vehicle parts to customers is recognized at the point in time of the transfer of control to the customer. Sales returns and allowances for vehicle parts are not significant.
Our Aviation Group revenues result from the sale of aircraft parts and performance of MRO services for private and commercial aircraft owners, other aviation MRO providers, and aviation original equipment manufacturers. Our Aviation Group recognizes revenues for the sale of aircraft parts at a point in time when control is transferred to the customer, which usually occurs when the parts are shipped. Our Aviation Group recognizes revenues for MRO services over time as the services are transferred to the customer. MRO services revenue recognized is measured based on the cost-to-cost input method, as costs incurred reflect the work completed, and therefore the services transferred to date. Sales returns and allowances are not significant.
Our Federal Services Group revenues result from professional and technical services, which we perform for customers on a contract basis. Revenue is recognized for performance obligations over time as we transfer the services to the customer. The three primary types of contracts used are cost-type, fixed-price and time and materials. Revenues result from work performed on these contracts by our employees and our subcontractors and from costs for materials and other work related costs allowed under our contracts.
Revenues on cost-type contracts are recorded as contract allowable costs are incurred and fees are earned. Variable consideration, typically in the form of award fees, is included in the estimated transaction price, to the extent that it is probable that a significant reversal will not occur, when there is a basis to reasonably estimate the amount of the fee. These estimates are based on historical award experience, anticipated performance and our best judgment based on current facts and circumstances.
Revenues on fixed-price contracts are recorded as work is performed over the period. Revenue is recognized over time using costs incurred to date relative to total estimated costs at completion to measure progress toward satisfying our performance obligations. Incurred cost represents work performed, which corresponds with the transfer of control to the customer. For such contracts, we estimate total costs at the inception of the contract based on our assumptions of the cost elements required to complete the associated tasks of the contract and assess the affects of the risks on our estimates of total costs to complete the contract. Our cost estimates are based on assumptions that include the complexity of the work, our employee labor costs, the cost of materials and the performance of our subcontractors. These cost estimates are subject to change as we perform under the contract and as a result, the timing of revenues and amount of profit on a contract may change as there are changes in estimated costs to complete the contract. Such adjustments are recognized on a cumulative catch-up basis in the period we identify the changes.
Revenues for time and materials contracts are recorded based on the amount for which we have the right to invoice our customers, because the amount directly reflects the value of our work performed for the customer. Revenues are recorded on the basis of contract allowable labor hours worked multiplied by the contract defined billing rates, plus the direct costs and indirect cost burdens associated with materials and subcontract work used in performance on the contract. Generally, profits on time and materials contracts result from the difference between the cost of services performed and the contract defined billing rates for these services.
Revenue related to work performed on government contracts at risk, which is work performed at the customer's request prior to the government formalizing funding, is not recognized until it can be reliably estimated and its realization is probable.
A substantial portion of contract and administrative costs are subject to audit by the Defense Contract Audit Agency. Our indirect cost rates have been audited and approved for 2013 and prior years with no material adjustments to our results of operations or financial position. While we maintain reserves to cover the risk of potential future audit adjustments based primarily on the results of prior audits, we do not believe any future audits will have a material adverse effect on our results of operations, financial position, or cash flows.
Revenues for 2017 and 2016
Revenue is recognized when persuasive evidence of an arrangement exists, delivery has occurred or services have been rendered, the fee is fixed or determinable, and collectability is probable.
Substantially all of our Supply Chain Management Group revenues result from the sale of vehicle parts to clients. We recognize revenue from the sale of vehicle parts when the customer takes ownership of the parts. Sales returns and allowances are not significant.
Our Aviation Group revenues are recognized upon the shipment or delivery of products to customers based on when title or risk of loss transfers to the customer. Sales returns and allowances are not significant.
Substantially all of our Federal Services work is performed for our customers on a contract basis. The three primary types of contracts used are cost-type, fixed-price and time and materials. Revenues result from work performed on these contracts by our employees and our subcontractors and from costs for materials and other work related costs allowed under our contracts.
Revenues on cost-type contracts are recorded as contract allowable costs are incurred and fees are earned. Our FMS Program contract is a cost plus award fee contract. This contract has terms that specify award fee payments that are determined by performance and level of contract activity. Award fees are made during the year through a contract modification authorizing the award fee that is issued subsequent to the period in which the work is performed. We recognize award fee income on the FMS Program contract when the fees are fixed or determinable. Due to such timing and fluctuations in the level of revenues, profits as a percentage of revenues on this contract will fluctuate from period to period.
Revenue recognition methods on fixed-price contracts will vary depending on the nature of the work and the contract terms. Revenues on fixed-price service contracts are recorded as work is performed, typically ratably over the service period. Revenues on fixed-price contracts that require delivery of specific items are recorded based on a price per unit as units are delivered.
Revenues for time and materials contracts are recorded on the basis of contract allowable labor hours worked multiplied by the contract defined billing rates, plus the direct costs and indirect cost burdens associated with materials and subcontract work
used in performance on the contract. Generally, profits on time and materials contracts result from the difference between the cost of services performed and the contract defined billing rates for these services.
Receivables and Allowance for Doubtful Accounts
Receivables are recorded at amounts earned less an allowance for doubtful accounts. We review our receivables regularly to determine if there are any potentially uncollectible accounts. The majority of our receivables are from government agencies, where there is minimal credit risk. We record allowances for bad debt as a reduction to receivables and an increase to bad debt expense. We assess the adequacy of these reserves by considering general factors, such as the length of time individual receivables are past due and historical collection experience.
Unbilled Receivables
Unbilled receivables include amounts typically resulting from sales under contracts when the cost-to-cost method of revenue recognition is utilized and revenue recognized exceeds the amount billed to the customer. The amounts may not exceed their estimated net realizable value. Unbilled receivables are classified as current based on our contract operating cycle.
Inventories
Inventories for our Supply Chain Group are stated at the lower of cost or net realizable value using the first-in, first-out ("FIFO") method. Included in inventory are related purchasing, storage and handling costs. Our inventory primarily consists of vehicle replacement parts.
Inventories for our Aviation Group are stated at lower of cost or net realizable value. Inventories for our Aviation Group primarily consist of general aviation jet aircraft engines and engine accessories and parts. The cost for purchased engines and parts is determined by the specific identification method. Included in inventory are related purchasing, overhaul labor, storage and handling costs. We also purchase aircraft engines for disassembly into individual parts and components.
Deferred Compensation Plans
We have a deferred compensation plan, the VSE Corporation Deferred Supplemental Compensation Plan ("DSC Plan"), to provide incentive and reward for certain management employees based on overall corporate performance. We maintain the underlying assets of the DSC Plan in a Rabbi Trust and changes in asset values are included in costs and operating expenses on the accompanying consolidated statements of income. We invest the assets held by the Rabbi Trust in both corporate owned life insurance ("COLI") products and in mutual funds. The COLI investments are recorded at cash surrender value and the mutual fund investments are recorded at fair value. The DSC Plan assets are included in other assets and the obligation to the participants is included in deferred compensation on the accompanying consolidated balance sheets.
Deferred compensation plan expense recorded as costs and operating expenses in the accompanying consolidated statements of income for the years ended December 31, 2018, 2017 and 2016 was approximately $2.1 million, $1.9 million and $1.7 million, respectively.
Impairment of Long-Lived Assets
Long-lived assets include intangible assets and property and equipment to be held and used. We review the carrying values of long-lived assets other than goodwill for impairment if events or changes in the facts and circumstances indicate that their carrying values may not be recoverable. We assess impairment by comparing the estimated undiscounted future cash flows of the related asset to its carrying value. If an asset is determined to be impaired, we recognize an impairment charge in the current period for the difference between the fair value of the asset and its carrying value.
No impairment charges related to long-lived assets, other than goodwill, were recorded in the years ended December 31, 2018, December 31, 2017 and December 31, 2016.
Income Taxes
Income taxes are accounted for under the asset and liability method. Under the asset and liability method, deferred tax assets and liabilities are recognized for the estimated future tax consequences attributable to differences between the financial
statement carrying amounts of existing assets and liabilities and their respective tax basis. This method also requires the recognition of future tax benefits, such as net operating loss carryforwards, to the extent that realization of such benefits is more likely than not. Deferred tax assets and liabilities are measured using enacted tax rates expected to apply to taxable income in the years in which those temporary differences are expected to be recovered or settled. The effect on deferred tax assets and liabilities of a change in tax rates is recognized in income in the period that includes the enactment date.
The carrying value of net deferred tax assets is based on assumptions regarding our ability to generate sufficient future taxable income to utilize these deferred tax assets.
Goodwill
We test goodwill for impairment annually in the fourth quarter and whenever events or changes in circumstances indicate the carrying value of goodwill may not be recoverable. Goodwill is tested for impairment at the reporting unit level. A qualitative assessment can be performed to determine whether it is more likely than not that the fair value of the reporting unit is less than its carrying value. If the reporting unit does not pass the qualitative assessment, we compare the fair value of each reporting unit to its carrying value using a quantitative assessment. If the fair value of the reporting unit exceeds its carrying value, goodwill is considered not impaired. If the fair value of the reporting unit is less than the carrying value, the difference is recorded as an impairment loss.
For the quantitative assessment, we estimate the fair value of each reporting unit using a combination of an income approach using a discounted cash flow ("DCF") analysis and a market-based valuation approach based on as comparable public company trading values. Determining the fair value of a reporting unit requires the exercise of significant management judgments, including the amount and timing of projected future revenues, earnings and cash flows, discount rates, long-term growth rates and comparable public company revenues and earnings multiples. The projected results used in our quantitative assessment are based on our best estimate as of the testing date of future revenues, earnings and cash flows after considering factors such as recent operating performance, general market and industry conditions, existing and expected future contracts, changes in working capital and long-term business plans and growth initiatives. The carrying value of each reporting unit includes the assets and liabilities employed in its operations and goodwill. There are no significant allocations of amounts held at the Corporate level to the reporting units.
Based on our annual goodwill impairment analysis we performed in the fourth quarter of 2018, the fair value of our reporting units exceeded their carrying values.
Intangible Assets
Intangible assets consist of the value of contract-related intangible assets, trade names and acquired technologies acquired in acquisitions. We amortize on a straight-line basis intangible assets acquired as part of acquisitions over their estimated useful lives unless their useful lives are determined to be indefinite. The amounts we record related to acquired intangibles are determined by us considering the results of independent valuations. Our contract-related intangibles are amortized over their estimated useful lives of approximately seven to 16 years with a weighted-average life of approximately 12.6 years as of December 31, 2018. We have four trade names that are amortized over an estimated useful life of approximately nine years. We have an acquired technologies intangible asset that is amortized over an estimated useful life of 11 years. The weighted-average life for all amortizable intangible assets is approximately 12.2 years as of December 31, 2018.
Recently Issued Accounting Pronouncements Not Yet Adopted
In February 2018, the Financial Accounting Standards Board (FASB) issued ASU No. 2018-02, Reclassification of Certain Tax Effects from Accumulated Other Comprehensive Income, which provides companies with an option to reclassify stranded tax effects resulting from enactment of the Tax Act from accumulated other comprehensive income to retained earnings. The new standard is effective for fiscal years beginning after December 15, 2018 with early adoption permitted. We currently are assessing whether to elect the option and the impact that this standard will have on our consolidated financial statements.
In August 2017, the FASB issued ASU No. 2017-12, Targeted Improvements to Accounting for Hedging Activities, which amends and simplifies existing guidance in order to allow companies to more accurately present the economic effects of risk management activities in the financial statements. The new standard is effective for fiscal years beginning after December 15,
2018 with early adoption permitted. We currently are assessing the impact that this standard will have on our consolidated financial statements.
In June 2016, the FASB issued ASU No. 2016-13, Measurement of Credit Losses on Financial Instruments, which changes the methodology for measuring credit losses on financial instruments and the timing of when such losses are recorded. The new standard is effective for reporting periods beginning after December 15, 2019 with early adoption permitted for reporting periods beginning after December 15, 2018. We currently are assessing the impact that this standard will have on our consolidated financial statements.
In February 2016, the FASB issued ASU No. 2016-02, Leases (Topic 842), to increase transparency and comparability among organizations by recognizing lease assets and lease liabilities on the balance sheet and disclosing key information about leasing arrangements. The new standard is required to be adopted using a modified retrospective method and is effective for reporting periods beginning after December 15, 2018, with early adoption permitted. In July 2018, the FASB provided an alternative transition method of adoption through ASU No. 2018-11, Targeted Improvements, which provides entities with an optional transition method to apply the transition provisions of ASU 2016-02 at the beginning of the period of adoption.
We elected to adopt the standard on January 1, 2019 using the alternative transition method provided by ASU 2018-11 whereby we will record right-of-use assets and lease liabilities for our existing leases as of January 1, 2019, as well as a cumulative-effect adjustment to retained earnings of initially applying the new standard as of January 1, 2019. In addition, the new standard provides several optional practical expedients for use in transition. We have elected the package of practical expedients permitted under the transition guidance, which does not require reassessment of prior conclusions related to lease identification, lease classification, and treatment for initial direct lease costs. We have not elected the practical expedients pertaining to the use of hindsight and land easements.
We are in the process of finalizing the changes required for the adoption of the new standard on our current lease arrangements, including our headquarters lease, as well as the quantitative impact this guidance will have on our consolidated financial statements and related disclosures. For our headquarters lease, which was accounted for using the financing method under previously existing build-to-suit accounting rules, we expect to derecognize existing liabilities of approximately $20.3 million and assets of $15.2 million as well as any related deferred taxes with a cumulative-effect adjustment of approximately $4.0 million recognized in opening retained earnings as of the January 1, 2019. We are continuing to evaluate the appropriate transition method for the headquarters lease, which as discussed was not previously accounted for as a lease under US GAAP. Upon adoption of the new standard, we will record a right-of-use asset and lease liability, ranging from $18 million to $24 million, on our consolidated balance sheets for our headquarters lease. Our other existing lease arrangements, which are currently classified as operating leases, will continue to be classified as operating leases under the new standard. For these operating leases, we estimate the standard will result in the recognition of right-of-use assets of approximately $5.5 million and lease liabilities of $5.6 million upon adoption on January 1, 2019, with immaterial changes to other balance sheet accounts. We do not anticipate that adoption of the new standard will have a significant impact on our consolidated results of operations or cash flows.
(2) Revenue Recognition
Disaggregated Revenue
Our revenues are derived from contract services performed for the United States Postal Service ("USPS"), United States Department of Defense ("DoD") agencies or federal civilian agencies and from the delivery of products to our clients. Our customers also include various other government agencies and commercial entities.
A summary of revenues for our operating groups by customer for the year ended December 31, 2018 is as follows (in thousands):
|
| | | | | | | | | | | | | | | | |
Customer | | Supply Chain Management | | Aviation | | Federal Services | | Total |
USPS | | $ | 175,339 |
| | $ | — |
| | $ | — |
| | $ | 175,339 |
|
DoD | | 24,280 |
| | 7,387 |
| | 302,827 |
| | 334,494 |
|
Commercial | | 14,329 |
| | 135,864 |
| | 413 |
| | 150,606 |
|
Other government | | 861 |
| | 2,172 |
| | 33,746 |
| | 36,779 |
|
| | $ | 214,809 |
| | $ | 145,423 |
| | $ | 336,986 |
| | $ | 697,218 |
|
A summary of revenues for our operating groups by contract type for the year ended December 31, 2018 is as follows (in thousands):
|
| | | | | | | | | | | | | | | | |
Contract Type | | Supply Chain Management | | Aviation | | Federal Services | | Total |
Cost-type | | $ | — |
| | $ | 4,863 |
| | $ | 188,867 |
| | $ | 193,730 |
|
Fixed-price | | 214,809 |
| | 84,600 |
| | 70,669 |
| | 370,078 |
|
Time and materials | | — |
| | 55,960 |
| | 77,450 |
| | 133,410 |
|
Total revenues | | $ | 214,809 |
| | $ | 145,423 |
| | $ | 336,986 |
| | $ | 697,218 |
|
Contract Balances
Billed receivables, unbilled receivables (contract assets), and contract liabilities are the results of revenue recognition, customer billing, and timing of payment receipts. Billed receivables, net, represent unconditional rights to consideration under the terms of the contract and include amounts billed and currently due from our customers. Unbilled receivables represent our right to consideration in exchange for goods or services that we have transferred to the customer prior to us having the right to payment for such goods or services. Contract liabilities are recorded when customers remit contractual cash payments in advance of us satisfying performance obligations under contractual arrangements, including those with performance obligations to be satisfied over a period of time.
We present our unbilled receivables and contract liabilities on a contract-by-contract basis. If a contract liability exists, it is netted against the unbilled receivables balance for that contract. Unbilled receivables decreased from $46.0 million at adoption of ASC 606 on January 1, 2018 to $41.3 million at December 31, 2018, primarily due to billings in excess of revenue recognized. Contract liabilities, which are included in accrued expenses and other current liabilities in our consolidated balance sheet, decreased from $9.8 million at adoption of ASC 606 on January 1, 2018 to $5.0 million at December 31, 2018, primarily due to revenue recognized in excess of advance payments received. For the year ended December 31, 2018, we recognized revenue of $7.9 million that was previously included in the beginning balance of contract liabilities.
Performance Obligations
Our performance obligations are satisfied over time as work progresses or at a point in time. Revenues from products and services transferred to customers over time accounted for approximately 57% of our revenues for the year ended December 31, 2018, primarily related to revenues in our Federal Services Group and for MRO services in our Aviation Group. Revenues from products and services transferred to customers at a point in time accounted for approximately 43% of our revenues for the year ended December 31, 2018. The majority of our revenue recognized at a point in time is for the sale of vehicle and aircraft parts in our Supply Chain Management and Aviation groups.
As of December 31, 2018, the aggregate amount of transaction prices allocated to unsatisfied or partially unsatisfied performance obligations was $290 million. Performance obligations expected to be satisfied within one year and greater than one year are 95% and 5%, respectively. We have applied the practical expedient for certain parts sales and MRO services to exclude the amount of remaining performance obligations for (i) contracts with an original expected term of one year or less or (ii) contracts for which we recognize revenue in proportion to the amount we have the right to invoice for services performed.
During the year ended December 31, 2018, revenue recognized from performance obligations satisfied in prior periods was not material.
(3) Receivables and Unbilled Receivables
Receivables, net and unbilled receivables, net as of December 31, 2018 and 2017, respectively, were as follows (in thousands):
|
| | | | | | | |
| 2018 | | 2017 |
Receivables, net | $ | 60,004 |
| | $ | 55,760 |
|
Unbilled receivables, net | 41,255 |
| | 42,577 |
|
| $ | 101,259 |
| | $ | 98,337 |
|
Receivables, net are recorded at face value less an allowance for doubtful accounts of approximately $79 thousand and $83 thousand as of December 31, 2018 and 2017, respectively.
The unbilled receivables balance includes certain costs for work performed at risk but which we believe will be funded by the government totaling approximately $4.7 million and $4.0 million as of December 31, 2018 and 2017, respectively. We expect to invoice substantially all unbilled receivables during 2019.
(4) Other Current Assets and Other Assets
At December 31, 2018 and 2017, other current assets primarily consisted of vendor advances, prepaid rents and deposits, prepaid income taxes, software licenses, prepaid maintenance agreements and deferred contract costs. At December 31, 2018 and 2017, other assets primarily consisted of deferred compensation plan assets.
(5) Property and Equipment
Property and equipment, net consisted of the following as of December 31, 2018 and 2017 (in thousands):
|
| | | | | | | |
| 2018 | | 2017 |
Buildings and building improvements | $ | 53,121 |
| | $ | 53,049 |
|
Computer equipment | 26,489 |
| | 27,775 |
|
Furniture, fixtures, equipment and other | 32,991 |
| | 30,704 |
|
Leasehold improvements | 600 |
| | 545 |
|
Land and land improvements | 4,551 |
| | 4,462 |
|
| 117,752 |
| | 116,535 |
|
Less accumulated depreciation and amortization | (68,146 | ) | | (61,389 | ) |
Total property and equipment, net | $ | 49,606 |
| | $ | 55,146 |
|
Depreciation and amortization expense for property and equipment for the years ended December 31, 2018, 2017 and 2016 was approximately $8.5 million, $9.3 million and $9.4 million, respectively.
(6) Goodwill and Intangible Assets
Changes in goodwill for the years ended December 31, 2018 and 2017 are as follows (in thousands):
|
| | | | | | | | | | | | | | | |
| Supply Chain Management | | Federal Services | | Aviation | | Total |
Balance as of December 31, 2016 | $ | 63,190 |
| | $ | 30,883 |
| | $ | 104,549 |
| | $ | 198,622 |
|
Increase from acquisitions | — |
| | — |
| | — |
| | — |
|
Balance as of December 31, 2017 | $ | 63,190 |
| | $ | 30,883 |
| | $ | 104,549 |
| | $ | 198,622 |
|
Increase from acquisitions | — |
| | — |
| | — |
| | — |
|
Balance as of December 31, 2018 | $ | 63,190 |
| | $ | 30,883 |
| | $ | 104,549 |
| | $ | 198,622 |
|
The results of our annual goodwill impairment testing in the fourth quarter of 2018 indicated that the fair value of our reporting units exceeded their carrying values.
Intangible assets consist of the value of contract-related assets, technologies and trade names. Amortization expense for the years ended December 31, 2018, 2017 and 2016 was approximately $16.0 million, $16.0 million and $16.1 million, respectively.
Intangible assets were comprised of the following (in thousands):
|
| | | | | | | | | | | | | | | |
| Cost | | Accumulated Amortization | | Accumulated Impairment Loss | | Net Intangible Assets |
December 31, 2018 | | | | | | | |
Contract and customer-related | $ | 173,094 |
| | $ | (86,076 | ) | | $ | (1,025 | ) | | $ | 85,993 |
|
Acquired technologies | 12,400 |
| | (8,533 | ) | | — |
| | 3,867 |
|
Trade names | 16,670 |
| | (11,638 | ) | | — |
| | 5,032 |
|
Total | $ | 202,164 |
| | $ | (106,247 | ) | | $ | (1,025 | ) | | $ | 94,892 |
|
| | | | | | | |
December 31, 2017 | |
| | |
| | |
| | |
|
Contract and customer-related | $ | 173,094 |
| | $ | (72,937 | ) | | $ | (1,025 | ) | | $ | 99,132 |
|
Acquired technologies | 12,400 |
| | (7,406 | ) | | — |
| | 4,994 |
|
Trade names | 16,670 |
| | (9,887 | ) | | — |
| | 6,783 |
|
Total | $ | 202,164 |
| | $ | (90,230 | ) | | $ | (1,025 | ) | | $ | 110,909 |
|
Future expected amortization of intangible assets is as follows for the years ending December 31, (in thousands):
|
| | | |
| Amortization |
2019 | $ | 15,953 |
|
2020 | 15,362 |
|
2021 | 14,998 |
|
2022 | 13,252 |
|
2023 | 9,252 |
|
Thereafter | 26,075 |
|
Total | $ | 94,892 |
|
(7) Debt
Long-term debt consisted of the following (in thousands):
|
| | | | | | | |
| December 31, |
| 2018 | | 2017 |
Bank credit facility - term loan | $ | 80,800 |
| | $ | 94,375 |
|
Bank credit facility - revolver loans | 81,934 |
| | 79,324 |
|
Principal amount of long-term debt | 162,734 |
| | 173,699 |
|
Less debt issuance costs | (2,135 | ) | | (1,125 | ) |
Total long-term debt | 160,599 |
| | 172,574 |
|
Less current portion | (9,466 | ) | | (6,960 | ) |
Long-term debt, net of current portion | $ | 151,133 |
| | $ | 165,614 |
|
We have a loan agreement with a group of banks to provide working capital support, letters of credit and finance acquisitions. The loan agreement, which was amended in January 2018 and expires in January 2023, is comprised of a term loan facility and a revolving loan facility. The revolving loan facility provides for revolving loans and letters of credit. The fair value
of outstanding debt under our bank loan facilities as of December 31, 2018 approximates its carrying value using Level 2 inputs based on market data on companies with a corporate rating similar to ours that have recently priced credit facilities.
Our required term loan payments after December 31, 2018 are as follows (in thousands):
|
| | | | |
Year ending December 31, | | |
2019 | | $ | 10,000 |
|
2020 | | 11,875 |
|
2021 | | 14,375 |
|
2022 | | 15,000 |
|
2023 | | 29,550 |
|
Total | | $ | 80,800 |
|
The maximum amount of credit available to us under the loan agreement for revolving loans and letters of credit as of December 31, 2018 was $300 million. We may borrow and repay the revolving loan borrowings as our cash flows require or permit. We pay an unused commitment fee and fees on letters of credit that are issued. We had approximately $57 thousand letters of credit outstanding as of December 31, 2018 and no of letters of credit outstanding as of December 31, 2017.
Under the loan agreement we may elect to increase the maximum availability of the term loan facility, the revolving loan facility, or both facilities up to an aggregate additional amount of $100 million.
We pay interest on the term loan borrowings and revolving loan borrowings at LIBOR plus a base margin or at a base rate (typically the prime rate) plus a base margin. As of December 31, 2018, the LIBOR base margin was 1.75% and the base rate base margin was 0.50%. The base margins increase or decrease in increments as our Total Funded Debt/EBITDA Ratio increases or decreases.
The loan agreement requires us to have interest rate hedges on a portion of the outstanding term loan for the first three years after the January 2018 amendment. We have executed compliant interest rate hedges. The amount of swapped debt outstanding as of December 31, 2018 was $50 million.
After taking into account the impact of hedging instruments, as of December 31, 2018, interest rates on portions of our outstanding debt ranged from 3.00% to 6.00%, and the effective interest rate on our aggregate outstanding debt was 4.17%.
Interest expense incurred on bank loan borrowings and interest rate hedges was approximately $6.9 million, $7.2 million and $7.8 million during the years ended December 31, 2018, 2017 and 2016, respectively.
The loan agreement contains collateral requirements to secure our loan agreement obligations, restrictive covenants, a limit on annual dividends, and other affirmative and negative covenants, conditions and limitations. Restrictive covenants include a maximum Total Funded Debt/EBITDA Ratio, which decreases over time, and a minimum Fixed Charge Coverage Ratio. We were in compliance with required ratios and other terms and conditions as of December 31, 2018.
(8) Accrued Expenses and Other Current Liabilities
Accrued expenses and other current liabilities consist primarily of accrued compensation and benefits of approximately $24.6 million and $23.3 million as of December 31, 2018 and 2017, respectively. The accrued compensation and benefits amounts include bonus, salaries and related payroll taxes, vacation and deferred compensation.
(9) Stock-Based Compensation Plans
In 2006, our stockholders approved the VSE Corporation 2006 Restricted Stock Plan for VSE's directors, officers and other employees (the "2006 Plan"). In May 2014, the stockholders approved amendments to the 2006 Plan extending its term until May 6, 2021 and authorizing an additional 500,000 shares of our common stock for issuance under the 2006 Plan. Under the 2006 Plan, we are authorized to issue up to 1,000,000 shares of our common stock and, as of December 31, 2018, 394,173 shares remained available for issuance under the 2006 Plan. The Compensation Committee is responsible for the administration of the 2006 Plan, and determines each recipient of an award under the 2006 Plan, the number of restricted shares of common stock
subject to such award and the period of continued employment required for the vesting of such award. These terms are included in award agreements between VSE and the recipients of the award.
During 2018, 2017 and 2016, non-employee directors were awarded 11,200, 16,100 and 17,600 shares of restricted stock, respectively, under the 2006 Plan. The weighted average grant-date fair value of these restricted stock grants was $49.38 per share, $39.85 per share, and $30.89 per share for the shares awarded in 2018, 2017 and 2016, respectively. The shares issued vested immediately and, without the Compensation Committee's approval, cannot be sold, transferred, pledged or assigned before the second anniversary of the grant date. Compensation expense related to these grants was approximately $553 thousand, $642 thousand and $544 thousand during 2018, 2017 and 2016, respectively.
In January of every year since 2007, we have notified certain employees that they are eligible to receive awards of VSE stock under our 2006 Plan, based on our financial performance for the respective fiscal years. These restricted stock awards vest ratably over three years and are expensed on an accelerated basis over the vesting period of approximately three years. Upon issuance of shares on each vesting date, the liability is reduced and additional paid-in capital is increased. The date of award determination is expected to be in March 2019 for the 2018 awards. The date of award determination for the 2017 awards and the 2016 awards was March 1, 2018 and 2017, respectively. On each vesting date, 100% of the vested award is paid in our shares. The number of shares issued is based on the fair market value of our common stock on the vesting date. On March 1, 2018, the employees eligible for the 2017 awards, 2016 awards and 2015 awards received a total of 31,159 shares of common stock. The grant-date fair value of these awards was $47.14 per share.
The total stock-based compensation expense related to restricted stock awards for the years ended December 31, are as follows (in thousands):
|
| | | | | | | | | | | |
| 2018 | | 2017 | | 2016 |
Employees | $ | 2,332 |
| | $ | 2,416 |
| | $ | 1,555 |
|
Non-employee Directors | 553 |
| | 642 |
| | 544 |
|
Total | $ | 2,885 |
| | $ | 3,058 |
| | $ | 2,099 |
|
Employees are permitted to use a certain number of shares of restricted stock to cover their personal tax liability for restricted stock awards. We paid approximately $641 thousand, $500 thousand and $499 thousand, to cover this liability in the years ended December 31, 2018, 2017 and 2016, respectively. These payments are classified as financing cash flows on the consolidated statements of cash flows. The total compensation cost related to non-vested awards not yet recognized was approximately $1.5 million with a weighted average amortization period of 1.8 years and $2.3 million with a weighted average amortization period of 1.7 years as of December 31, 2018 and 2017, respectively.
Stock-based compensation consisting of restricted stock awards was included in costs and operating expenses and provision for income taxes on the accompanying statements of income for the years ended December 31, 2018, 2017 and 2016 (in thousands):
|
| | | | | | | | | | | |
| 2018 | | 2017 | | 2016 |
Stock-based compensation included in costs and operating expenses | $ | 3,027 |
| | $ | 3,068 |
| | $ | 2,109 |
|
Income tax benefit recognized for stock-based compensation | (755 | ) | | (1,180 | ) | | (811 | ) |
Stock-based compensation expense, net of income tax benefit | $ | 2,272 |
| | $ | 1,888 |
| | $ | 1,298 |
|
(10) Income Taxes
We are subject to U.S. federal income tax as well as income tax in multiple state and local jurisdictions. We have concluded all U.S. federal income tax matters as well as material state and local tax matters for years through 2014.
The Tax Cuts and Jobs Act (the "Tax Act") was enacted on December 22, 2017. The Tax Act significantly affects the U.S. corporate income tax by, among other things, lowering the statutory corporate tax rate from 35% to 21%. In connection with the permanent reduction in the U.S. statutory corporate tax rate, we recalculated our net deferred tax liabilities as of December 31, 2017 and recorded a provisional tax benefit of approximately $10.6 million in 2017.
We applied the guidance in Staff Accounting Bulletin 118 when accounting for the enactment-date effects of the Tax Act in 2017 and throughout 2018. At December 31, 2017, we had substantially completed our provisional analysis of the income tax effects of the Tax Act and recorded a reasonable estimate in 2017 of such effects. During 2018, we refined our calculations, evaluated changes in interpretations and assumptions that we had made, applied additional guidance issued by the U.S. Government,
and evaluated actions and related accounting policy decisions we have made. As of December 22, 2018, we completed our accounting for all of the enactment-date income tax effects of the Tax Act and identified an additional tax benefit of approximately $795 thousand to the provisional one-time charge for the year ended December 31, 2017, related to the Tax Act.
We file consolidated federal income tax returns that include all of our subsidiaries. The components of the provision for income taxes from continuing operations for the years ended December 31, 2018, 2017 and 2016 are as follows (in thousands):
|
| | | | | | | | | | | |
| 2018 | | 2017 | | 2016 |
Current | | | | | |
Federal | $ | 9,667 |
| | $ | 14,149 |
| | $ | 13,648 |
|
State | 1,758 |
| | 2,511 |
| | 2,379 |
|
Foreign | 140 |
| | — |
| | — |
|
| 11,565 |
| | 16,660 |
| | 16,027 |
|
Deferred | |
| | |
| | |
|
Federal | (1,114 | ) | | (10,645 | ) | | (983 | ) |
State | (347 | ) | | 110 |
| | (163 | ) |
Foreign | 64 |
| | (136 | ) | | — |
|
| (1,397 | ) | | (10,671 | ) | | (1,146 | ) |
Provision for income taxes | $ | 10,168 |
| | $ | 5,989 |
| | $ | 14,881 |
|
The differences between the amount of tax computed at the federal statutory rate of 21% in 2018 and 35% in 2017 and 2016, and the provision for income taxes from continuing operations for the years ended December 31, 2018, 2017 and 2016 are as follows (in thousands):
|
| | | | | | | | | | | |
| 2018 | | 2017 | | 2016 |
Tax at statutory federal income tax rate | $ | 9,502 |
| | $ | 15,780 |
| | $ | 14,586 |
|
Increases (decreases) in tax resulting from: | |
| | |
| | |
|
State taxes, net of federal tax benefit | 1,861 |
| | 1,732 |
| | 1,599 |
|
Permanent differences, net | 367 |
| | (275 | ) | | (545 | ) |
Impact of Tax Act | (795 | ) | | (10,556 | ) | | — |
|
Other provision adjustments | (767 | ) | | (692 | ) | | (759 | ) |
Provision for income taxes | $ | 10,168 |
| | $ | 5,989 |
| | $ | 14,881 |
|
Certain amounts from the prior years have been reclassified to conform to the current year presentation.
The tax effect of temporary differences representing deferred tax assets and liabilities as of December 31, 2018 and 2017 are as follows (in thousands): |
| | | | | | | |
| 2018 | | 2017 |
Gross deferred tax assets | | | |
Deferred compensation and accrued paid leave | $ | 5,794 |
| | $ | 5,594 |
|
Accrued expenses | 1,310 |
| | 1,013 |
|
Stock-based compensation | 819 |
| | 772 |
|
Reserve for contract disallowances | 120 |
| | 84 |
|
Acquisition-related expenses | 151 |
| | — |
|
Capitalized inventory | 742 |
| | 916 |
|
State operating loss carryforward | 24 |
| | 263 |
|
Tax credit carryforward | 47 |
| | 178 |
|
Foreign country operating loss carryforward | 157 |
| | 136 |
|
Foreign country valuation allowance | (107 | ) | | — |
|
Total gross deferred tax assets | 9,057 |
| | 8,956 |
|
| | | |
Gross deferred tax liabilities | | | |
Interest rate swaps | (49 | ) | | (74 | ) |
Depreciation | (1,739 | ) | | (2,439 | ) |
Deferred revenues | (2,164 | ) | | (1,875 | ) |
Goodwill and intangible assets | (23,395 | ) | | (23,854 | ) |
Prepaid expenses | (120 | ) | | — |
|
Total gross deferred tax liabilities | (27,467 | ) | | (28,242 | ) |
| | | |
Net deferred tax liabilities | $ | (18,410 | ) | | $ | (19,286 | ) |
(11) Commitments and Contingencies
(a) Leases and Other Commitments
We have various non-cancelable operating leases for facilities, equipment, and software with terms between two and 15 years. The terms of the facilities leases typically provide for certain minimum payments as well as increases in lease payments based upon the operating cost of the facility and the consumer price index. Rent expense is recognized on a straight-line basis for rent agreements having escalating rent terms. Lease expense for the years ended December 31, 2018, 2017 and 2016 was as follows (in thousands):
|
| | | | | | | | | | | |
| Operating Lease Expense | | Sublease Income | | Net Expense |
2018 | $ | 3,363 |
| | $ | 1,198 |
| | $ | 2,165 |
|
2017 | $ | 4,924 |
| | $ | 1,134 |
| | $ | 3,790 |
|
2016 | $ | 5,100 |
| | $ | 888 |
| | $ | 4,212 |
|
Future minimum annual non-cancelable commitments as of December 31, 2018 are as follows (in thousands):
|
| | | | | | | | | | | |
| Operating Leases |
| Lease Commitments | | Sublease Income | | Net Commitments |
2019 | $ | 2,527 |
| | $ | — |
| | $ | 2,527 |
|
2020 | 1,479 |
| | — |
| | 1,479 |
|
2021 | 1,270 |
| | — |
| | 1,270 |
|
2022 | 1,189 |
| | — |
| | 1,189 |
|
2023 | 898 |
| | — |
| | 898 |
|
Thereafter | 167 |
| | — |
| | 167 |
|
Total | $ | 7,530 |
| | $ | — |
| | $ | 7,530 |
|
We signed a lease in 2009 for our headquarters building with a rent commencement date of May 1, 2012. Certain terms in the lease agreement resulted in the capitalization of construction costs due to specific accounting rules. We recorded a construction asset and corresponding long-term liability of approximately $27.3 million on May 1, 2012, which represents the construction costs incurred by the landlord as of that date. According to accounting rules, we have forms of continuing involvement that required us to account for this transaction as a financing lease upon commencement of the lease period. The building and building improvements are included on our consolidated balance sheets and are being depreciated over a 15-year period. The accumulated depreciation of the construction asset was $12.1 million and $10.9 million as of December 31, 2018 and 2017, respectively. Payments made under the lease agreement are applied to service the financing obligation and interest expense based on an imputed interest rate amortizing the obligation over the life of the lease agreement. The long-term lease liability of $18.7 million and $20.3 million as of December 31, 2018 and 2017, respectively, is included in long-term lease obligations in our consolidated balance sheets. The current portion of our obligation, which is included in accrued expenses and other current liabilities in our consolidated balance sheets, was $1.6 million and $1.4 million as of December 31, 2018 and 2017, respectively.
Future minimum annual non-cancelable commitments under our headquarters lease as of December 31, 2018, which are not included in the table above, are as follows (in thousands):
|
| | | | | | | | | | | |
| Lease Commitments | | Sublease Income | | Net Commitments |
2019 | $ | 4,456 |
| | $ | 376 |
| | $ | 4,080 |
|
2020 | 4,579 |
| | — |
| | 4,579 |
|
2021 | 4,705 |
| | — |
| | 4,705 |
|
2022 | 4,827 |
| | — |
| | 4,827 |
|
2023 | 4,948 |
| | — |
| | 4,948 |
|
Thereafter | 17,388 |
| | — |
| | 17,388 |
|
Total | $ | 40,903 |
| | $ | 376 |
| | $ | 40,527 |
|
(b) Contingencies
On or about April 19, 2018 Joseph Waggoner, on behalf of himself and all similarly situated individuals, filed a lawsuit against VSE and two of our subcontractors in the United State District Court, Eastern District of Texas, Texarkana Division, alleging overtime compensation entitlement at a rate of one and one-half times their regular rate of pay for all hours worked over 40 hours in a workweek. The plaintiffs have certified the case as a collective action for similarly situated individuals. The plaintiffs work under a contract between defendants and the United States Army at the Red River Army Depot in Texas. The plaintiffs assert that employees' 15-minute unpaid work breaks should have been included as "working hours" in calculating overtime. We believe it is probable that VSE will incur a loss related to this matter. We have accrued an immaterial loss provision in an amount representing our reasonable estimate related to an unfavorable settlement of the matter, and we do not believe that we have any further exposure that would be material to VSE in excess of the amount we have accrued related to this matter.
In addition to the above-referenced legal proceeding, we may have certain claims in the normal course of business, including legal proceedings, against us and against other parties. In our opinion, the resolution of these other claims will not have a material adverse effect on our results of operations, financial condition, or cash flows. However, because the results of any legal proceedings cannot be predicted with certainty, the amount of loss, if any, cannot be reasonably estimated.
Further, from time-to-time, government agencies investigate whether our operations are being conducted in accordance with applicable contractual and regulatory requirements. Government investigations of us, whether relating to government contracts or conducted for other reasons, could result in administrative, civil or criminal liabilities, including repayments, fines or penalties being imposed upon us, or could lead to suspension or debarment from future government contracting. Government investigations often take years to complete and many result in no adverse action against us. We believe, based upon current information, that the outcome of any such government disputes and investigations will not have a material adverse effect on our results of operations, financial condition or cash flows.
(12) Business Segments and Customer Information
Segment Information
Beginning in 2017, we changed our structure and as a result our former IT, Energy and Management Consulting Group was combined with our Federal Services Group. Consequently, our segment financial information for 2016 has been restated to reflect such change. Management of our business operations is conducted under three reportable operating segments:
Supply Chain Management Group – Our Supply Chain Management Group supplies vehicle parts primarily through a Managed Inventory Program ("MIP") and direct sales to the USPS and to other customers.
Aviation Group – Our Aviation Group provides MRO services, parts supply and distribution, and supply chain solutions for commercial and general aviation jet aircraft engines and engine accessories.
Federal Services Group – Our Federal Services Group provides engineering, industrial, logistics, foreign military sales, legacy equipment sustainment services, IT and technical and consulting services primarily to the DoD and other government agencies.
These segments operate under separate management teams and financial information is produced for each segment. We evaluate segment performance based on consolidated revenues and operating income. Net sales of our business segments exclude intersegment sales as these activities are eliminated in consolidation.
Our segment information is as follows (in thousands):
|
| | | | | | | | | | | |
For the years ended December 31, | | | | | |
| 2018 | | 2017 | | 2016 |
Revenues | | | | | |
Supply Chain Management Group | $ | 214,809 |
| | $ | 214,542 |
| | $ | 205,475 |
|
Aviation Group | 145,423 |
| | 134,809 |
| | 133,466 |
|
Federal Services Group | 336,986 |
| | 410,762 |
| | 352,849 |
|
Total revenues | $ | 697,218 |
| | $ | 760,113 |
| | $ | 691,790 |
|
| | | | | |
Operating income: | |
| | |
| | |
|
Supply Chain Management Group | $ | 30,626 |
| | $ | 33,754 |
| | $ | 34,632 |
|
Aviation Group | 11,076 |
| | 9,695 |
| | 12,823 |
|
Federal Services Group | 15,797 |
| | 13,419 |
| | 7,796 |
|
Corporate expenses | (3,269 | ) | | (2,543 | ) | | (3,722 | ) |
Operating income | $ | 54,230 |
| | $ | 54,325 |
| | $ | 51,529 |
|
| | | | | |
Depreciation and amortization expense: | |
| | |
| | |
|
Supply Chain Management Group | $ | 7,299 |
| | $ | 6,536 |
| | $ | 6,445 |
|
Aviation Group | 5,123 |
| | 4,835 |
| | 5,461 |
|
Federal Services Group | 12,802 |
| | 14,511 |
| | 14,140 |
|
Total depreciation and amortization | $ | 25,224 |
| | $ | 25,882 |
| | $ | 26,046 |
|
| | | | | |
Capital expenditures: | |
| | |
| | |
|
Supply Chain Management Group | $ | 802 |
| | $ | 1,376 |
| | $ | 4,195 |
|
Aviation Group | 1,772 |
| | 1,387 |
| | 1,459 |
|
Federal Services Group | 209 |
| | 177 |
| | 94 |
|
Corporate | 334 |
| | 373 |
| | 1,624 |
|
Total capital expenditures | $ | 3,117 |
| | $ | 3,313 |
| | $ | 7,372 |
|
|
| | | | | | | |
| December 31, |
| 2018 | | 2017 |
Total assets: | | | |
Supply Chain Management Group | $ | 166,015 |
| | $ | 176,860 |
|
Aviation Group | 316,197 |
| | 282,738 |
|
Federal Services Group | 92,098 |
| | 102,372 |
|
Corporate | 64,518 |
| | 67,043 |
|
Total assets | $ | 638,828 |
| | $ | 629,013 |
|
Revenues are net of inter-segment eliminations. Corporate expenses are primarily selling, general and administrative expenses not allocated to segments. In the third quarter of 2018, we completed the sale of a contract we had been awarded by the National Institutes of Health, which resulted in a $1.7 million gain recorded within our Federal Services Group. Included in our Corporate expenses for 2016 is a charge of approximately $3.3 million for the settlement of the Heritage Litigation offset by a gain of approximately $1.4 million resulting primarily from the Maritime Administration contract close-outs. Corporate assets are primarily cash, property and equipment and investments held in separate trust.
Customer Information
Our revenues are derived from contract services performed for DoD agencies or federal civilian agencies and from the delivery of products to our clients. The USPS, U.S. Army and Army Reserve, and U.S. Navy are our largest customers. Our customers also include various other government agencies and commercial entities. Our revenue by customer is as follows for the years ended December 31, (in thousands):
|
| | | | | | | | | | | | | | | | | | |
| | Revenues by Customer Years ended December 31, |
Customer | | 2018 | | % | | 2017 | | % | | 2016 | | % |
USPS | | $ | 175,339 |
| | 25.1 | | $ | 180,205 |
| | 23.7 | | $ | 181,215 |
| | 26.2 |
| | | | | | | | | | | | |
U.S. Navy | | 160,952 |
| | 23.1 | | 206,644 |
| | 27.2 | | 190,155 |
| | 27.5 |
U.S. Army | | 156,519 |
| | 22.5 | | 188,462 |
| | 24.8 | | 139,764 |
| | 20.2 |
U.S. Air Force | | 17,023 |
| | 2.4 | | 7,123 |
| | 0.9 | | 3,482 |
| | 0.5 |
Total - DoD | | 334,494 |
| | 48.0 | | 402,229 |
| | 52.9 | | 333,401 |
| | 48.2 |
| | | | | | | | | | | | |
Commercial Aviation | | 135,864 |
| | 19.5 | | 126,960 |
| | 16.7 | | 131,067 |
| | 19.0 |
Other Commercial | | 14,742 |
| | 2.1 | | 12,498 |
| | 1.7 | | 10,721 |
| | 1.5 |
Total - Commercial | | 150,606 |
| | 21.6 | | 139,458 |
| | 18.4 | | 141,788 |
| | 20.5 |
| | | | | | | | | | | | |
Other Government | | 36,779 |
| | 5.3 | | 38,221 |
| | 5.0 | | 35,386 |
| | 5.1 |
| | | | | | | | | | | | |
Total | | $ | 697,218 |
| | 100.0 | | $ | 760,113 |
| | 100.0 | | $ | 691,790 |
| | 100.0 |
We do not measure revenue or profit by product or service lines, either for internal management or external financial reporting purposes, because it would be impractical to do so. Products offered and services performed are determined by contract requirements and the types of products and services provided for one contract bear no relation to similar products and services provided on another contract. Products and services provided vary when new contracts begin or current contracts expire. In many cases, more than one product or service is provided under a contract or contract task order. Accordingly, cost and revenue tracking is designed to best serve contract requirements and segregating costs and revenues by product or service lines in situations for which it is not required would be difficult and costly to both us and our customers.
Geographical Information
Revenue by geography is based on the billing address of the customer. Our revenue by geographic area is as follows (in thousands):
|
| | | | | | | | | | | | |
| | Years ended December 31, |
| | 2018 | | 2017 | | 2016 |
United States | | $ | 647,168 |
| | $ | 708,474 |
| | $ | 638,726 |
|
Other Countries (1) | | 50,050 |
| | 51,639 |
| | 53,064 |
|
Total revenue | | $ | 697,218 |
| | $ | 760,113 |
| | $ | 691,790 |
|
(1) No individual country, other than disclosed above, exceeded 10% of our total revenue for any period presented.
(13) Capital Stock
Common Stock
Our common stock has a par value of $0.05 per share. Proceeds from common stock issuances that are greater than $0.05 per share are credited to additional paid in capital. Holders of common stock are entitled to one vote per common share held on all matters voted on by our stockholders. Stockholders of record are entitled to the amount of dividends declared per common share held.
(14) 401(k) Plan
We maintain a defined contribution plan under Section 401(k) of the Internal Revenue Code of 1986, as amended, that covers substantially all of our employees. Under the provisions of our 401(k) plan, employees' eligible contributions are matched at rates specified in the plan documents. Our expense associated with this plan was approximately $5.9 million, $6.2 million and $6.3 million for the years ended December 31, 2018, 2017, and 2016, respectively.
(15) Fair Value Measurements
The accounting standard for fair value measurements defines fair value, and establishes a market-based framework or hierarchy for measuring fair value. The standard is applicable whenever assets and liabilities are measured at fair value.
The fair value hierarchy established in the standard prioritizes the inputs used in valuation techniques into three levels as follows:
Level 1 – Observable inputs – quoted prices in active markets for identical assets and liabilities;
Level 2 – Observable inputs other than the quoted prices in active markets for identical assets and liabilities – includes quoted prices for similar instruments, quoted prices for identical or similar instruments in inactive markets, and amounts derived from valuation models where all significant inputs are observable in active markets; and
Level 3 – Unobservable inputs – includes amounts derived from valuation models where one or more significant inputs are unobservable and require us to develop relevant assumptions.
The following table summarizes the financial assets and liabilities measured at fair value on a recurring basis as of December 31, 2018 and December 31, 2017 and the level they fall within the fair value hierarchy (in thousands):
|
| | | | | | | | | | | | |
Amounts Recorded at Fair Value | | Financial Statement Classification | | Fair Value Hierarchy | | Fair Value December 31, 2018 | | Fair Value December 31, 2017 |
Non-COLI assets held in Deferred Supplemental Compensation Plan | | Other assets | | 1 | | $ | 403 |
| | $ | 389 |
|
Interest rate swaps | | Other current assets | | 2 | | $ | 195 |
| | $ | 294 |
|
Non-COLI assets held in the deferred supplemental compensation plan consist of equity funds with fair value based on observable inputs such as quoted prices for identical assets in active markets and changes in its fair value are recorded as selling, general and administrative expenses.
We account for our interest rate swap agreements under the provisions of ASC 815, Derivatives and Hedging, and have determined that our swap agreements qualify as cash flow hedges. Accordingly, the fair value of the swap agreements, which is an asset recorded in other current assets of approximately $195 thousand and approximately $294 thousand at December 31, 2018 and 2017, respectively. The offset, net of an income tax effect of approximately $49 thousand and $113 thousand is included in accumulated other comprehensive income in the accompanying balance sheets as of December 31, 2018 and 2017, respectively. The amounts paid and received on the swap agreements are recorded in interest expense in the period during which the related floating-rate interest is incurred. We determine the fair value of the swap agreements based on a valuation model using market data inputs.
(16) Selected Quarterly Data (Unaudited)
The following table shows selected quarterly data for 2018 and 2017, in thousands, except earnings per share.
|
| | | | | | | | | | | | | | | |
| 2018 Quarters |
| 1st | | 2nd | | 3rd | | 4th |
| | | | | | | |
Revenues | $ | 176,897 |
| | $ | 170,394 |
| | $ | 168,931 |
| | $ | 180,996 |
|
Costs and operating expenses | $ | 165,304 |
| | $ | 156,539 |
| | $ | 154,934 |
| | $ | 167,911 |
|
Operating income (1) | $ | 11,593 |
| | $ | 13,855 |
| | $ | 15,697 |
| | $ | 13,085 |
|
Net income | $ | 7,052 |
| | $ | 8,751 |
| | $ | 10,034 |
| | $ | 9,243 |
|
| | | | | | | |
Basic earnings per share: | |
| | |
| | |
| | |
|
Net income | $ | 0.65 |
| | $ | 0.80 |
| | $ | 0.92 |
| | $ | 0.85 |
|
Basic weighted average shares outstanding | 10,861 |
| | 10,881 |
| | 10,881 |
| | 10,882 |
|
| | | | | | | |
Diluted earnings per share: | |
| | |
| | |
| | |
|
Net income | $ | 0.65 |
| | $ | 0.80 |
| | $ | 0.92 |
| | $ | 0.84 |
|
Diluted weighted average shares outstanding | 10,897 |
| | 10,919 |
| | 10,935 |
| | 10,993 |
|
(1) Operating income for the third quarter of 2018 includes a $1.7 million gain from the sale of a contract.
|
| | | | | | | | | | | | | | | |
| 2017 Quarters |
| 1st | | 2nd | | 3rd | | 4th |
| | | | | | | |
Revenues | $ | 197,294 |
| | $ | 193,860 |
| | $ | 174,164 |
| | $ | 194,795 |
|
Costs and operating expenses | $ | 183,098 |
| | $ | 178,855 |
| | $ | 161,927 |
| | $ | 181,908 |
|
Operating income | $ | 14,196 |
| | $ | 15,005 |
| | $ | 12,237 |
| | $ | 12,887 |
|
Net income (1) | $ | 7,293 |
| | $ | 7,807 |
| | $ | 6,639 |
| | $ | 17,357 |
|
| | | | | | | |
Basic earnings per share: | | | | | | | |
Net income (1) | $ | 0.67 |
| | $ | 0.72 |
| | $ | 0.61 |
| | $ | 1.60 |
|
Basic weighted average shares outstanding | 10,823 |
| | 10,838 |
| | 10,838 |
| | 10,838 |
|
| | | | | | | |
Diluted earnings per share: | |
| | |
| | |
| | |
|
Net income (1) | $ | 0.67 |
| | $ | 0.72 |
| | $ | 0.61 |
| | $ | 1.59 |
|
Diluted weighted average shares outstanding | 10,849 |
| | 10,862 |
| | 10,857 |
| | 10,903 |
|
(1) For the fourth quarter of 2017 net income and basic and diluted earnings per share were affected by the Tax Cuts and Jobs Act. See Note 10 "Income Taxes" for additional information.
(17) Subsequent Events
In January 2019, we acquired 100% of the equity of two privately held companies, both named 1st Choice Aerospace Inc. (collectively, "1st Choice Aerospace"), that specialize in maintenance, repair and overhaul (“MRO”) services for new generation and legacy commercial aircraft families. 1st Choice Aerospace will operate as a combined group under our subsidiary VSE Aviation, Inc. to expand our sustainment services into the aviation supply chain market. We have retained key members of 1st Choice Aerospace's management team under three-year employment contracts with five-year non-compete covenants.
The aggregate initial cash purchase price for 1st Choice Aerospace was approximately $112 million (subject to working capital adjustments) which was funded under our existing bank revolving loan. We will also be required to make earn-out payments to the sellers of 1st Choice Aerospace of up to $40 million if 1st Choice Aerospace meets certain financial targets during 2019 and 2020.
We incurred approximately $569 thousand of acquisition-related expenses as of December 31, 2018 which are included in selling, general and administrative expenses.
We expect to account for the 1st Choice Aerospace acquisition as a business combination.
ITEM 9. Changes in and Disagreements with Accountants on Accounting and Financial Disclosure
None.
ITEM 9A. Controls and Procedures
Evaluation of Disclosure Controls and Procedures
Our management has evaluated, with the participation of our Chief Executive Officer and Chief Financial Officer, the effectiveness of our disclosure controls and procedures (as defined in Rules 13a-15(e) and 15(d)-15(e) under the Securities Exchange Act of 1934, as amended (the "Exchange Act"). Based on this evaluation, our Chief Executive Officer and Chief Financial Officer have concluded that, as of such date, our disclosure controls and procedures were effective to ensure that information we are required to disclose in reports that we file or submit under the Exchange Act is recorded, processed, summarized and reported within the time periods specified in Securities and Exchange Commission rules and forms and that such information is accumulated and communicated to our management, including our Chief Executive Officer and Chief Financial Officer, as appropriate, to allow timely decisions regarding required disclosure.
Management's Report on Internal Control Over Financial Reporting
Management is responsible for establishing and maintaining adequate internal control over financial reporting, as such term is defined in Exchange Act Rules 13a-15(f) and 15d-15(f). Under the supervision and with the participation of our management, including our Chief Executive Officer and Chief Financial Officer, we conducted an assessment of the effectiveness of our internal control over financial reporting as of December 31, 2018 based on the framework in Internal Control – Integrated Framework issued by the Committee of Sponsoring Organizations of the Treadway Commission (2013 Framework). Based on our assessment under the framework in Internal Control – Integrated Framework, our management concluded that our internal control over financial reporting was effective as of December 31, 2018. Ernst & Young LLP, our independent registered public accounting firm, has issued an opinion on our internal control over financial reporting. This opinion appears in the Report of Independent Registered Public Accounting Firm set forth below.
Change in Internal Controls
During the fourth quarter of fiscal year 2018, there were no changes in our internal control over financial reporting (as defined in Rules 13a-15(f) and 15d-15(f) under the Exchange Act) that have materially affected these controls, or are reasonably likely to materially affect these controls subsequent to the evaluation of these controls.
Report of Independent Registered Public Accounting Firm
The Board of Directors and Stockholders of VSE Corporation
Opinion on Internal Control over Financial Reporting
We have audited VSE Corporation and Subsidiaries’ internal control over financial reporting as of December 31, 2018, based on criteria established in Internal Control-Integrated Framework issued by the Committee of Sponsoring Organizations of the Treadway Commission (2013 framework) (the COSO criteria). In our opinion, VSE Corporation and Subsidiaries (the Company) maintained, in all material respects, effective internal control over financial reporting as of December 31, 2018, based on the COSO criteria.
We also have audited, in accordance with the standards of the Public Company Accounting Oversight Board (United States) (PCAOB), the consolidated balance sheets of the Company as of December 31, 2018 and 2017, the related consolidated statements of income, comprehensive income, stockholders’ equity and cash flows for each of the three years in the period ended December 31, 2018, and the related notes and our report dated March 6, 2019 expressed an unqualified opinion thereon.
Basis for Opinion
The Company’s management is responsible for maintaining effective internal control over financial reporting and for its assessment of the effectiveness of internal control over financial reporting included in the accompanying Management’s Report on Internal Control Over Financial Reporting. Our responsibility is to express an opinion on the Company’s internal control over financial reporting based on our audit. We are a public accounting firm registered with the PCAOB and are required to be independent with respect to the Company in accordance with the U.S. federal securities laws and the applicable rules and regulations of the Securities and Exchange Commission and the PCAOB.
We conducted our audit in accordance with the standards of the PCAOB. Those standards require that we plan and perform the audit to obtain reasonable assurance about whether effective internal control over financial reporting was maintained in all material respects.
Our audit included obtaining an understanding of internal control over financial reporting, assessing the risk that a material weakness exists, testing and evaluating the design and operating effectiveness of internal control based on the assessed risk, and performing such other procedures as we considered necessary in the circumstances. We believe that our audit provides a reasonable basis for our opinion.
Definition and Limitations of Internal Control Over Financial Reporting
A company’s internal control over financial reporting is a process designed to provide reasonable assurance regarding the reliability of financial reporting and the preparation of financial statements for external purposes in accordance with generally accepted accounting principles. A company’s internal control over financial reporting includes those policies and procedures that (1) pertain to the maintenance of records that, in reasonable detail, accurately and fairly reflect the transactions and dispositions of the assets of the company; (2) provide reasonable assurance that transactions are recorded as necessary to permit preparation of financial statements in accordance with generally accepted accounting principles, and that receipts and expenditures of the company are being made only in accordance with authorizations of management and directors of the company; and (3) provide reasonable assurance regarding prevention or timely detection of unauthorized acquisition, use, or disposition of the company’s assets that could have a material effect on the financial statements.
Because of its inherent limitations, internal control over financial reporting may not prevent or detect misstatements. Also, projections of any evaluation of effectiveness to future periods are subject to the risk that controls may become inadequate because of changes in conditions, or that the degree of compliance with the policies or procedures may deteriorate.
/s/ Ernst & Young LLP
|
| |
Tysons, Virginia | |
March 6, 2019 | |
ITEM 9B. Other Information
None.
PART III
Except as otherwise indicated below, the information required by Items 10, 11, 12, 13 and 14 of Part III of Form 10-K has been omitted in reliance of General Instruction G(3) to Form 10-K and is incorporated herein by reference to our definitive proxy statement to be filed with the SEC not later than 120 days after December 31, 2018 in respect of the Annual Meeting of VSE's stockholders scheduled to be held on May 7, 2019 (the "Proxy Statement").
ITEM 10. Directors, Executive Officers and Corporate Governance
See Item 4 under the caption "Executive Officers of Registrant," and the remaining information required by this Item is incorporated by reference to the Proxy Statement.
ITEM 11. Executive Compensation
VSE and its chief executive officer, president and chief operating officer, Maurice A. Gauthier entered into an amendment dated March 1, 2019, to the Amended and Restated Employment Agreement, dated December 6, 2013 (as amended on December 14, 2016), between VSE and Mr. Gauthier, providing for, among other things, his compensation for 2019 as follows:
(a) for the period commencing on January 1, 2019 and ending on April 1, 2019:
(i) an annual base salary of $810,000, to be prorated through April 1, 2019;
(ii) a payment of $314,280, to be made on or before April 8, 2019, composed of (1) $20,250 in lieu of a salary increase for 2019, (2) $222,750 in lieu of participating in VSE's Executive Incentive Plan, and (3) $71,280 in lieu of participating in VSE's Deferred Supplemental Compensation Plan; and
(iii) an award under VSE's 2006 Restricted Stock Plan of $300,713, payable in fully vested VSE Stock on or before April 8, 2019, with the number of shares of VSE stock calculated by dividing 300,713 by the closing price of VSE’s common stock on April 2, 2019.
(b) if VSE's Board of Directors and Mr. Gauthier agree that he shall continue serving as a director, chief executive officer, president and chief operating officer after April 1, 2019 (for a period ending no later than April 1, 2020, any such period, the “Interim Period”):
(i) a salary of $74,250 per month during the Interim Period (provided that if the Interim Period expires on any day of the month other than the last day of the month, the salary for such portion of the month shall be calculated by multiplying $74,250 by a fraction, the numerator of which is the number of calendar days that have lapsed during such month, and the denominator is 30);
(ii) within 10 business days after the expiration of the Interim Period, an amount calculated by multiplying $222,750 by a fraction, the numerator of which is the number of calendar days that have lapsed during the Interim Period, and the denominator of which is 90 (the “Fraction”), in lieu of participating in VSE's Executive Incentive Plan;
(iii) within 10 business days after expiration of the Interim Period, an amount calculated by multiplying $71,280 by the Fraction, in lieu of participating in VSE's Deferred Supplemental Compensation Plan; and
(iv) an award under VSE's 2006 Restricted Stock Plan in an amount equal to $300,713 multiplied by the Fraction, payable in fully vested VSE Stock, within 10 business days after expiration of the Interim Period, with the number of shares of such VSE Stock calculated by dividing the amount of the award by the closing price of VSE Stock on the first trading day after expiration of the Interim Period.
Under the above-mentioned Amended and Restated Employment Agreement, as amended on March 1, 2019 (the “Agreement”), Mr. Gauthier will continue to serve as VSE’s chief executive officer, president and chief operating officer until at least April 1, 2019 (or, upon the subsequent agreement of VSE's Board of Directors and Mr. Gauthier, until a later date.
The above-referenced March 1, 2019 amendment also provides that during the period commencing on the first day after the expiration of the Stub Term, except that, if an Interim Period occurs, during the period commencing on the first day after the expiration of such Interim Period, and ending on the first anniversary of the expiration of the Stub Term, except that if an Interim period occurs, ending on the first anniversary of the expiration of such Interim Term (“Consulting Period”), Mr. Gauthier will serve VSE as an independent contractor, rendering, on VSE’s behalf, consulting services of up to 14 hours per month (inclusive of any associated preparation and travel time), primarily in respect of VSE’s transition to a successor chief executive officer and president, and VSE (x) will pay Mr. Gauthier $10,000 per month during the Consulting Period as compensation for any such consulting services and (y) reimburse him for all reasonable, proper and documented business expenses that he incurs during the Consulting Period in the performance of his consulting services in accordance with VSE’s customary reimbursement practices for its chief executive officer. Mr. Gauthier may terminate this consulting arrangement upon 10 business days prior written notice to VSE, at which time the Consulting Period will terminate.
The foregoing description of the March 1, 2019 Amendment to the above-referenced Amended and Restated Employment Agreement does not purport to be complete, and is qualified in its entirety by reference to the full text of the Amendment, a copy of which is attached as an Exhibit to this Form 10-K. Incorporated herein by reference (subject to the disclosure set forth above), is the disclosure regarding the above-referenced Amended and Restated Employment Agreement(as amended on December 14, 2016), set forth in VSE’s definitive proxy statement dated April 3, 2018 (and filed with the SEC on such date), and copies of such Amend and Restated Employment Agreement (including the previous amendment thereto) have been included as Exhibits with reports filed by the Company with the SEC as noted in the Exhibit Index to this Form 10-K.
The remaining information required by this Item 11 is incorporated herein by reference to the Proxy Statement.
ITEM 12. Security Ownership of Certain Beneficial Owners and Management and Related Stockholder Matters
Except for the "Equity Compensation Plan Information" disclosed in Item 5(e) above, the information required by this Item is incorporated by reference to the Proxy Statement.
ITEM 13. Certain Relationships and Related Transactions, and Director Independence
The information required by this Item is incorporated by reference to the Proxy Statement.
ITEM 14. Principal Accountant Fees and Services
The information required by this Item is incorporated by reference to the Proxy Statement.
PART IV
ITEM 15. Exhibits and Financial Statement Schedules
1.Financial Statements
The consolidated financial statements are listed under Item 8 of this Form 10-K.
2.Supplemental Financial Statement Schedules
All schedules have been omitted because they are not applicable, not required, or the information has been otherwise supplied in the financial statements or notes to the financial statements.
3.Exhibits
See "Exhibit Index" hereinafter contained and incorporated by reference.
|
| | |
| EXHIBIT INDEX | |
| | |
Reference No. Per Item 601 of Regulation S-K | Description of Exhibit | Exhibit No. In this Form 10-K |
| | |
3.1 | | * |
3.2 | | * |
4.1 | Instruments defining the rights of security holders, including indentures Specimen Stock Certificate as of May 19, 1983 (Exhibit 4 to Registration Statement No. 2-83255 dated April 22, 1983 on Form S-2) | * + P |
10.1 | Material contracts | |
10.2 | | * + |
10.3 | | * + |
10.4 | | * + |
10.5 | | * |
10.6 | | * |
10.7 | | * + |
10.8 | | * + |
21.1 | | Exhibit 21 |
23.1 | | Exhibit 23.1 |
31.1 | | Exhibit 31.1 |
31.2 | | Exhibit 31.2 |
32.1 | | Exhibit 32.1 |
32.2 | | Exhibit 32.2 |
|
| | |
99.1 | | * |
101.INS | XBRL Instance Document | |
101.SCH | XBRL Taxonomy Extension Schema Document | |
101.CAL | XBRL Taxonomy Extension Calculation Linkbase Document | |
101.DEF | XBRL Taxonomy Extension Definition Linkbase Document | |
101.LAB | XBRL Taxonomy Extension Label Linkbase Document | |
101.PRE | XBRL Taxonomy Extension Presentation Linkbase Document | |
* Document has been filed as indicated and is incorporated by reference herein.
+ Indicates management contract or compensatory plan or arrangement.
P Indicates exhibit was submitted to the Securities and Exchange Commission as a paper filing prior to the time that electronic filing on EDGAR became mandatory.
SIGNATURES
Pursuant to the requirements of Section 13 or 15(d) of the Securities Exchange Act of 1934, Registrant has duly caused this report to be signed on its behalf by the undersigned, thereunto duly authorized.
|
| | | |
| | | VSE CORPORATION |
| | | |
Date: | March 6, 2019 | By: | /s/ M. A. Gauthier |
| | | M. A. Gauthier |
| | | Chief Executive Officer, |
| | | President and Chief Operating |
| | | Officer |
Pursuant to the requirements of the Securities Exchange Act of 1934, this report has been signed by the following persons on behalf of Registrant and in the capacities and on the dates indicated.
|
| | |
Name | Title | Date |
| | |
| | |
/s/ Maurice A. Gauthier | Director, Chief Executive | March 6, 2019 |
Maurice A. Gauthier | Officer, President and | |
| Chief Operating Officer | |
| | |
| | |
/s/ Thomas R. Loftus | Executive Vice President | March 6, 2019 |
Thomas R. Loftus | and Chief Financial Officer | |
| (Principal Financial and | |
| Accounting Officer) | |
| | |
| | |
/s/ Calvin S. Koonce | Chairman/Director | March 6, 2019 |
Calvin S. Koonce | | |
| | |
| | |
/s/ James F. Lafond | Director | March 6, 2019 |
James F. Lafond | | |
| | |
| | |
/s/ Bonnie K. Wachtel | Director | March 6, 2019 |
Bonnie K. Wachtel | | |
| | |
| | |
/s/ Ralph E. Eberhart | Director | March 6, 2019 |
Ralph E. Eberhart | | |
| | |
| | |
/s/ Jack C. Stultz | Director | March 6, 2019 |
Jack C. Stultz | | |
| | |
| | |
/s/ John E. Potter | Director | March 6, 2019 |
John E. Potter | | |
| | |
| | |
/s/ Mark E. Ferguson III | Director | March 6, 2019 |
Mark E. Ferguson III | | |