UNITED STATES
SECURITIES AND EXCHANGE COMMISSION
Washington, D.C. 20549
FORM 10-K
ANNUAL REPORT PURSUANT TO SECTION 13 OR 15(d)
OF THE SECURITIES EXCHANGE ACT OF 1934
For the Fiscal Year Ended December 31, 2016 Commission File Number: 0‑3676
VSE CORPORATION
(Exact Name of Registrant as Specified in its Charter)
|
| |
DELAWARE | 54-0649263 |
(State or Other Jurisdiction of Incorporation or Organization) | (I.R.S. Employer Identification No.) |
|
| | | | |
6348 Walker Lane | | | | |
Alexandria, Virginia | | 22310 | | www.vsecorp.com |
(Address of Principal Executive Offices) | | (Zip Code) | | (Webpage) |
Registrant's Telephone Number, Including Area Code: (703) 960-4600
Securities registered pursuant to Section 12(b) of the Act:
|
| |
Title of each class | Name of each exchange on which registered |
Common Stock, par value $.05 per share | The NASDAQ Global Select Market |
Securities registered pursuant to Section 12(g) of the Act: None
Indicate by check mark if the registrant is a well-known seasoned issuer, as defined in Rule 405 of the Securities Act. Yes [ ] No
[x]
Indicate by check mark if the registrant is not required to file reports pursuant to Section 13 or Section 15(d) of the Act. Yes [ ] No [x]
Indicate by check mark whether the registrant (1) has filed all reports required to be filed by Section 13 or 15(d) of the Securities Exchange Act of 1934 during the preceding 12 months (or for such shorter period that the registrant was required to file such reports), and (2) has been subject to such filing requirements for the past 90 days. Yes [x] No [ ]
Indicate by check mark whether the registrant has submitted electronically and posted on its corporate Web site, if any, every Interactive Data File required to be submitted and posted pursuant to Rule 405 of Regulation S-T (section 232.405 of this chapter) during the preceding 12 months (or for such shorter period that the registrant was required to submit and post such files).
Yes [x] No [ ]
Indicate by check mark if disclosure of delinquent filers pursuant to Item 405 of Regulation S-K is not contained herein, and will not be contained, to the best of registrant's knowledge, in definitive proxy or information statements incorporated by reference in Part III of this Form 10-K or any amendment to this Form 10-K. [ ]
Indicate by check mark whether the registrant is a large accelerated filer, an accelerated filer, a non-accelerated filer, or a smaller reporting company. See definition of "large accelerated filer," "accelerated filer" and "smaller reporting company" in Rule 12b-2 of the Exchange Act.
Large accelerated filer [ ] Accelerated filer [x] Non-accelerated filer [ ] Smaller reporting company [ ]
Indicate by check mark whether the registrant is a shell company (as defined in Rule 12b-2 of the Act). Yes [ ] No [x]
The aggregate market value of outstanding voting stock held by non-affiliates of the Registrant as of June 30, 2016, was approximately $284 million based on the last reported sales price of the registrant's common stock on The NASDAQ Global Select Market as of that date.
Number of shares of Common Stock outstanding as of February 27, 2017: 10,814,927.
DOCUMENTS INCORPORATED BY REFERENCE
Portions of Registrant's definitive proxy statement for the Annual Meeting of Stockholders expected to be held on May 2, 2017, are incorporated herein by reference into Part III of this report.
|
| | |
TABLE OF CONTENTS |
| | Page |
| | |
| | |
ITEM 1 | | |
ITEM 1A | | |
ITEM 1B | | |
ITEM 2 | | |
ITEM 3 | | |
ITEM 4 | | |
ITEM 4(a) | | |
| | |
| | |
| | |
ITEM 5 | | |
ITEM 6 | | |
ITEM 7 | | |
ITEM 7A | | |
ITEM 8 | | |
ITEM 9 | | |
ITEM 9A | | |
ITEM 9B | | |
| | |
| | |
| | |
ITEM 10 | | |
ITEM 11 | | |
ITEM 12 | | |
ITEM 13 | | |
ITEM 14 | | |
| | |
| | |
| | |
ITEM 15 | | |
| | |
| | |
| | |
| | |
Forward Looking Statements
This Annual Report on Form 10-K ("Form 10-K") contains statements that, to the extent they are not recitations of historical fact, constitute "forward looking statements" under federal securities laws. All such statements are intended to be subject to the safe harbor protection provided by applicable securities laws. For discussions identifying some important factors that could cause actual VSE Corporation ("VSE," the "Company," "us," "our," or "we") results to differ materially from those anticipated in the forward looking statements contained in this filing, see VSE's "Narrative Description of Business" (Items 1, 1A, 2 and 3), and Item 7 "Management's Discussion and Analysis of Financial Condition and Results of Operations." Readers are cautioned not to place undue reliance on these forward looking statements, which reflect management's analysis only as of the date hereof. The Company undertakes no obligation to publicly revise these forward looking statements to reflect events or circumstances that occur or arise after the date hereof. Readers should also carefully review the risk factors described in other documents the Company files from time to time with the Securities and Exchange Commission, including Quarterly Reports on Form 10-Q filed by the Company subsequent to this Form 10-K and any Current Reports on Form 8-K filed by the Company.
PART I
ITEM 1. Business
(a) General Background
We are a diversified services and supply chain management company that assists our clients in sustaining, extending the service life, and improving the performance of their transportation, equipment, and other assets and systems. We provide logistics and distribution services for legacy systems and equipment and professional and technical services to the United States Government (the "government"), including the United States Department of Defense ("DoD"), the United States Postal Service ("USPS"), federal civilian agencies, and commercial and other customers. Our largest customers are the DoD and the USPS. Our operations include supply chain management solutions, parts supply and distribution, and maintenance, repair, and overhaul (“MRO”) services for vehicle fleet, aviation, and other clients; vehicle and equipment maintenance and refurbishment; logistics; engineering; energy and environmental services; IT and health care IT solutions; and consulting services.
VSE was incorporated in Delaware in 1959 and the parent company serves as a centralized managing and consolidating entity for our operating groups, each of which consists of one or more subsidiaries (all of which are wholly owned) or unincorporated divisions that perform our services. VSE’s operating groups include our Supply Chain Management Group, Aviation Group, Federal Services Group, and IT, Energy and Management Consulting Group. The term "VSE" or "Company" means VSE and its subsidiaries and divisions unless the context indicates operations of only VSE as the parent company.
(b) Financial Information
Our operations are conducted within four reportable segments aligned with our operating groups: (1) Supply Chain Management, which generated 29.7% of our revenues in 2016; (2) Aviation, which generated 19.3% of our revenues in 2016; (3) Federal Services, which generated approximately 44.2% of our revenues in 2016; and (4) IT, Energy and Management Consulting, which generated 6.8% of our revenues in 2016. Additional financial information for our reportable segments appears in Item 7 "Management’s Discussion and Analysis of Financial Condition and Results of Operations” and in Item 8 "Financial Statements and Supplementary Data” of this Form 10-K.
(c) Description of Business
Services and Products
We apply a broad array of capabilities and resources to support our clients’ transportation assets, vehicle fleets, aircraft, systems, equipment and processes. We focus on creating value by sustaining the life and improving the performance of our client assets through core offerings in supply chain management, MRO, equipment refurbishment, logistics and engineering. We also provide IT solutions, health care IT, and consulting services.
Typical service offerings include supply chain and inventory management services; vehicle fleet sustainment programs; vehicle fleet parts supply and distribution; MRO of aircraft engines and engine components; aircraft engine parts supply and distribution; engineering support for military vehicles; military equipment refurbishment and modification; ship MRO and follow-on technical support; logistics management support; machinery condition analysis; specification preparation for ship alterations; ship’s force crew training; life cycle support for ships; ship communication systems; energy conservation, energy efficiency, sustainable energy supply, and electric power grid modernization projects; technology road-mapping; IT enterprise architecture development, information assurance/business continuity, security risk management, and network services; medical logistics; and medical command and control. See Item 7 “Management’s Discussion and Analysis of Financial Information and Results of Operations” below for more information regarding our business.
Revenues and Contracts
Our revenues are derived from the delivery of products and from contract services performed for our clients. We offer our products and professional and technical services through various ordering agreements and negotiated and competitive contract arrangements.
Our Supply Chain Management Group revenues result from the sale of vehicle parts to the USPS and other government and commercial clients. We recognize revenue from the sale of vehicle parts when the customer takes ownership of the parts.
Our Aviation Group revenues result from the sale of aircraft parts and performance of MRO services for private and commercial aircraft owners, other aviation MRO providers, and aviation original equipment manufacturers. We recognize revenues upon the shipment or delivery of products to customers based on when title or risk of loss transfers to the customer.
Our Federal Services and IT, Energy and Management Consulting Group revenues result primarily from cost plus fixed fee, cost plus award fee, time and materials, or fixed-price contracts with the government. Revenues result from work performed on these contracts by our own employees, from work performed by our subcontractors, and from costs of materials used in performing the work. Revenues on cost‑type contracts are recorded as allowable costs are incurred and fees are earned. Revenues for time and materials contracts are recorded on the basis of allowable labor hours worked multiplied by the contract defined billing rates, plus the cost of materials used in performance on the contract. Profits or losses on time and material contracts result from the difference between the cost of services performed and the contract defined billing rates for these services. Revenue recognition methods on fixed-price contracts vary depending on the nature of the work and the contract terms. Revenues on fixed-price service contracts are recorded as work is performed, typically ratably over the service period. Revenues on fixed-price contracts that require delivery of specific items are recorded based on a price per unit as units are delivered.
The USPS, U.S. Army, and U.S. Navy are our largest customers. Our customers also include various other government and commercial entities.
|
| | | | | | | | | | | | | | | | | | | | | |
| | Revenues by Customer (dollars in thousands) Years ended December 31, |
Customer | | 2016 | | % | | 2015 | | % | | 2014 | | % |
U. S. Postal Service | | $ | 181,215 |
| | 26.2 |
| | $ | 184,876 |
| | 34.6 |
| | $ | 167,268 |
| | 39.4 |
|
| | | | | | | | | |
| | |
U.S. Navy | | 190,155 |
| | 27.5 |
| | 98,887 |
| | 18.5 |
| | 88,007 |
| | 20.7 |
|
U.S. Army | | 139,764 |
| | 20.2 |
| | 80,086 |
| | 15.0 |
| | 101,714 |
| | 24.0 |
|
U.S. Air Force | | 3,482 |
| | 0.5 |
| | 3,558 |
| | 0.7 |
| | 3,323 |
| | 0.8 |
|
Total - DoD | | 333,401 |
| | 48.2 |
| | 182,531 |
| | 34.2 |
| | 193,044 |
| | 45.5 |
|
| | | | | | | | | |
| | |
Commercial Aviation | | 131,067 |
| | 19.0 |
| | 119,729 |
| | 22.4 |
| | — |
| | — |
|
Other Commercial | | 10,721 |
| | 1.5 |
| | 4,653 |
| | 0.9 |
| | 3,680 |
| | 0.9 |
|
Total - Commercial | | 141,788 |
| | 20.5 |
| | 124,382 |
| | 23.3 |
| | 3,680 |
| | 0.9 |
|
| | | | | | | | | | | | |
Department of Energy | | 11,708 |
| | 1.7 |
| | 16,020 |
| | 3.0 |
| | 19,000 |
| | 4.5 |
|
Social Security Administration | | 9,762 |
| | 1.4 |
| | 9,666 |
| | 1.8 |
| | 10,153 |
| | 2.4 |
|
Other Government | | 13,916 |
| | 2.0 |
| | 16,507 |
| | 3.1 |
| | 30,926 |
| | 7.3 |
|
Total - Other Civilian Agencies | | 35,386 |
| | 5.1 |
| | 42,193 |
| | 7.9 |
| | 60,079 |
| | 14.2 |
|
| |
| | | | | | | |
| | |
Total | | $ | 691,790 |
| | 100.0 |
| | $ | 533,982 |
| | 100.0 |
| | $ | 424,071 |
| | 100.0 |
|
Backlog
Funded backlog represents a measure of potential future revenues from work performed by our Federal Services and IT, Energy and Management Consulting groups on government contracts. Funded backlog is defined by us as the total value of contracts that has been appropriated and funded by the procuring agencies, less the amount of revenues that have already been recognized on such contracts. Our reported backlog is comprised of funding received by us in incremental amounts for work that is generally expected to be completed within six to 12 months following the award of the funding. Our funded backlog for our Federal Services and IT, Energy and Management Consulting groups as of December 31, 2016, was approximately $322 million and as of December 31, 2015 and 2014 it was approximately $238 million and $193 million, respectively. Changes in funded backlog on contracts are sometimes unpredictable due to uncertainties associated with changing government program priorities and availability of funds, which is heavily dependent upon the congressional authorization and appropriation process. Delays in this process may temporarily diminish the availability of funds for ongoing and planned work.
In addition to funded backlog levels, we have contract ceiling amounts available for use on multiple award, indefinite delivery, indefinite quantity contracts with DoD and federal civilian agencies. While these contracts increase the opportunities
available for us to pursue future work, the actual amount of future work is indeterminate until task orders are placed on the contracts. Frequently, these task orders are competitively awarded. Additionally, these task orders must be funded by the procuring agencies before we can perform work and begin generating revenues.
Marketing
Our marketing activities are conducted at the operating group level by our marketing and business development staff and our professional staff of sales representatives, managers, and other personnel. New customer contacts and information concerning new programs, requirements and opportunities become available through attendance at industry trade shows and events, through sales calls and client servicing, through negotiation with key business partners, through formal and informal briefings, from participation in professional organizations, in the course of contract performance, and from literature published by government, trade associations, professional organizations and commercial entities.
Personnel
Our employees have a variety of specialized experience, training, and skills that provide the expertise required to service our clients. Some have high levels of education. As of December 31, 2016, we had 2,523 employees, an increase from 2,057 as of December 31, 2015. Principal employee categories include (a) mechanics and vehicle, aircraft, and equipment technicians, (b) logisticians, (c) warehouse and sales personnel, (d) engineers and technicians in mechanical, electronic, industrial, energy and environmental services, and (e) information technology professionals in computer systems, applications and products, configuration, change and data management disciplines. The expertise required by our customers frequently includes knowledge of government regulations and procedures.
We actively seek initiatives and participate in outreach programs to assist individuals who have served in the U.S. Armed Forces. These efforts include an emphasis on hiring military veterans, which we believe enhances the quality of our workforce. Approximately 30% of our employees have previously served as members in the U.S. Armed Forces.
Competition
The supply chain, logistics, and MRO services offered by our Supply Chain Management and Aviation groups and the federally contracted professional and technical services offered by our Federal Services and IT, Energy and Management Consulting groups are conducted in very competitive operating environments.
The vehicle parts aftermarket and aviation parts and servicing markets are fragmented, with many large and small competitors that compete for our customer base.
Large diversified federal contracting firms with greater financial resources and larger technical staffs are capable of providing the same services offered by us. Government agencies emphasize awarding contracts on a competitive basis as opposed to a sole source or other noncompetitive basis. Most of the significant contracts under which we currently perform services were either initially awarded on a competitive basis or have been renewed at least once on a competitive basis. There is no assurance regarding the level of work we may obtain under some of these contracts. Government budgets, and in particular the budgets of certain government agencies, can also affect competition in our business. A general decline in government budgets, a reallocation of government spending priorities, or a reallocation of work for small business set-aside programs that results in lower levels of potential business in the markets we serve or the services we offer will cause increased competition.
The extent of competition that we will encounter as a result of changing economic or competitive conditions, customer requirements or technological developments is unpredictable. We believe the principal competitive factors for our business are customer knowledge, technical and financial qualifications, past performance, government budgetary stress, and price, which has been more heavily weighted in recent years.
Available Information
Copies of our publicly available Annual Reports on Form 10-K, Quarterly Reports on Form 10-Q, Current Reports on Form 8-K and amendments to those reports are filed with or otherwise furnished to the Securities and Exchange Commission (“SEC”) pursuant to Section 13(a) or 15(d) of the Securities Exchange Act of 1934, as amended. Such reports and amendments are also available free of charge through our website www.vsecorp.com as soon as reasonably practicable after the reports are electronically filed with the SEC.
ITEM 1A. Risk Factors
Our future results may differ materially from past results and from those projected in the forward-looking statements contained in this Form 10-K due to various uncertainties and risks, including those risks set forth below, non-recurring events and other important factors disclosed previously and from time to time in our other reports filed with the SEC.
Uncertain government budgets and shifting government priorities could delay contract awards and funding and adversely affect our ability to continue work under our government contracts. Additionally, federal procurement directives could result in our loss of work on current programs to small business set-asides and large multiple award contracts.
Our government business is subject to funding delays, terminations (including at the government's convenience), reductions, in-sourcing, extensions, and moratoriums associated with the government’s budgeting and contracting process. The federal procurement environment is unpredictable and could adversely affect our ability to perform work under new and existing contracts. We have experienced delays in contract awards and funding on our contracts in recent years that have adversely affected our ability to continue existing work and to replace expiring work. Additionally, our government business is subject to the risk that one or more of our potential contracts or contract extensions may be diverted by the contracting agency to a small or disadvantaged or minority-owned business pursuant to set-aside programs administered by the Small Business Administration, or may be bundled into large multiple award contracts for very large businesses. These risks can potentially have an adverse effect on our revenue growth and profit margins.
Increased market competition resulting from decreases in government spending for contract services and government contracting award criteria could adversely affect our ability to sustain our revenue levels.
Pressure on government budgets may adversely affect the flow of work to federal contractors, particularly new programs. Competitor contractors that experience a loss of government work have tended to redirect their marketing efforts toward the types of work that we perform. This increase in competition for our service offerings has adversely affected our ability to win new work or successor contracts to continue work that is currently performed by us under expiring contracts. Unsuccessful bidders frequently protest contract awards, which can delay or reverse the contract awards. Additionally, the government has trended toward contract award criteria that emphasizes lowest price, technically acceptable bids, which further intensifies competition in our government markets.
Certain programs comprise a material portion of our revenue. Our work on large government programs presents a risk to revenue growth and profit margins and sustainability.
The eventual expiration of large government programs or the loss of or disruption of revenues on a single contract may reduce our revenues and profits. Such revenue losses could also erode profits on our remaining programs that would have to absorb a larger portion of the fixed corporate costs previously allocated to the expiring programs or discontinued contract work. Our USPS managed inventory program (“MIP”) and our foreign military sales program with the U.S. Navy (“FMS Program”) each constitute a material portion of our revenues. This concentration of our revenue subjects us to risk of material adverse revenue disruptions if customer operational decisions, government contractual, or other issues prevent or delay the fulfillment of work requirements associated with these key programs. In recent years, revenue levels for our FMS Program have fluctuated widely enough to cause material changes in our overall revenue levels and affect our profit margins.
Global economic conditions and political factors could adversely affect our revenues.
Revenues from our government programs for which work is performed in foreign countries are subject to economic conditions in these countries and to political risks posed by ongoing foreign conflicts and potential terrorist activity. Services performed by our employees on our FMS Program are, to a certain extent, dependent on our placement of employees in a client country. Significant domestic and political unrest in client countries can constrain our ability to maintain consistent staffing levels, resulting in a fluctuating level of services performed by our employees. We cannot predict when these conditions will occur or the effect it will have on our FMS Program revenues. Regime changes in these countries can result in government restrictions upon the continuation of ongoing work.
Economic conditions in both the United States and foreign countries, and global prices and availability of oil and other commodities could potentially have an adverse effect on the demand for some of our services, including our aviation services.
Due to the nature of our work we could potentially be exposed to legal actions arising from our operations.
Our work includes many manual tasks, including warehousing, shipping and packing of truck parts inventory, maintaining and repairing military and non-military vehicles and equipment, and maintaining and overhauling U.S. Navy ships. We also repair engines and engine accessories for general aviation jet aircraft. Some of our work efforts involve the handling of hazardous materials. These services may pose certain challenges that could cause us to be exposed to legal and other liabilities arising from performance issues, work related incidents, or employee misconduct that result in damages, injury or death to third parties. Such events could cause us to suffer financial losses and adversely affect our financial condition. (See Item 3. "Legal Proceedings.”)
Technology security and cyber attack risks could potentially impact our financial results.
We face the threat to our computer systems of unauthorized access, computer hackers, computer viruses, malicious code, organized cyber-attacks and other security problems and system disruptions, including possible unauthorized access to our and our clients' proprietary or classified information.
Some of our contract work includes data management and technology services associated with Social Security Administration and military medical and health records. This exposes us to certain information and technology security risks. If there is a security breach of sensitive data in our custody or for which we provide services, we could possibly be held liable for damages to third parties related to such security breach and incur costs to prevent future incidents. We also provide refurbishment, maintenance and training services support to international clients directly and through DoD. Foreign nations with interests that conflict with the international clients we support could be motivated to conduct a cyber-attack to access information on these programs.
Costs associated with preventing or remediating information management security breaches have not had a material adverse effect on our capital expenditures, earnings, or competitive position. However, the occurrence of a future security breach event could potentially have such an adverse effect.
Acquisitions, which have been a part of our business strategy in recent years, present certain risks.
The acquisition of a business that subsequently does not meet expected operating and financial performance targets, the ineffective integration of an acquisition, or our inability to service debt associated with making an acquisition could adversely affect our financial performance. Also, the failure to make or timely complete an acquisition could adversely affect our financial performance.
The nature of our operations and work performed by our employees present certain challenges related to work force management.
Our financial performance is heavily dependent on the abilities of our operating and administrative staff with respect to technical skills, operating performance, pricing, cost management, safety, and administrative and compliance efforts. A wide diversity of contract types, nature of work, work locations, and legal and regulatory complexities challenges our administrative staff and skill sets. We also face challenges associated with our quality of workforce, quality of work, safety, and labor relations compliance. Our current and projected work in foreign countries exposes us to challenges associated with export and ethics compliance, local laws and customs, workforce issues, extended supply chain, political unrest and war zone threats. Failure to attract or retain an adequately skilled workforce, lack of knowledge or training in critical functions, or inadequate staffing levels can result in lost work, reduced profit margins, losses from cost overruns, performance deficiencies, workplace accidents, and regulatory noncompliance.
Our business could be adversely affected by incidents that could cause an interruption in our operations or impose a significant financial liability on us.
Disruption of our operations due to internal or external system or service failures, accidents or incidents involving employees or third parties working in high-risk locations, or natural disasters or other crises could adversely affect our financial performance and condition. A fire, flood, earthquake, or other natural disaster at physical facilities that support key revenue generating operations, or a procurement system or contractual delay could potentially interrupt the revenues from our operations.
We are subject to numerous government rules and regulations that could expose us to potential liabilities or work loss.
We must comply with and are affected by laws and regulations relating to the award, administration and performance of government contracts. A violation of laws or regulations could result in the imposition of fines and penalties or the termination of contracts or debarment from working or bidding on government contracts.
In some instances, these government contract laws and regulations impose terms or rights that are significantly more favorable to the government than those typically available to commercial parties in negotiated transactions. For example, the government may terminate any government contract or subcontract at its convenience, as well as for performance default.
A termination for default could expose us to liability and have a material adverse effect on our ability to compete for future contracts and orders. A termination for default could also impact our past performance and ability to obtain new or additional work. In addition, the government could terminate a prime contract under which we are a subcontractor, irrespective of the quality of services provided by us as a subcontractor.
Additionally, our contract work that is performed by our subcontractors is subject to government compliance, performance requirements and financial risks. If any of our subcontractors fail to timely meet their contractual obligations or have regulatory compliance or other problems, our ability to fulfill our obligations as a prime contractor may be jeopardized.
The aviation industry is highly regulated by the U.S. Federal Aviation Administration ("FAA") and equivalent regulatory agencies in other countries. Aviation engines and engine components that we sell must meet certain airworthiness standards established by the FAA or the equivalent agencies in certain other countries. We also operate repair facilities that are licensed by the FAA and equivalent agencies of certain other countries to perform such services. New and more stringent regulations may be adopted in the future that could have an adverse effect on us.
Our business could be adversely affected by government audits or investigations.
Government agencies, including the Defense Contract Audit Agency and the Department of Labor, routinely audit and investigate government contractors. These agencies review a contractor’s performance under its contracts, cost structure and compliance with applicable laws, regulations and standards. The government also may review the adequacy of, and a contractor’s compliance with, its internal control systems and policies, including the contractor’s purchasing, property, estimating, compensation and management information systems. Any costs found to be improperly allocated to a specific contract will not be reimbursed and any such costs already reimbursed must be refunded. If an audit uncovers improper or illegal activities, we may be subject to civil and criminal penalties and administrative sanctions, including termination of contracts, forfeiture of profits, suspension of payments, fines and suspension or debarment from doing business with the government. In addition, we could suffer serious harm to our reputation if allegations of impropriety were made. As we perform more international work, the risk of compliance with the Foreign Corrupt Practices Act and Export Control Act increases.
Investments in facilities could cause losses if certain work is disrupted or discontinued.
We have made investments in facilities and lease commitments to support specific business programs, work requirements, and service offerings. A slowing or disruption of these business programs, work requirements, or service offerings that results in operating below intended levels could cause us to suffer financial losses.
Environmental and pollution risks could potentially impact our financial results.
Some of our contract work includes the use of chemical solvents and the handling of hazardous materials to maintain, repair, and refurbish vehicles, aircraft engines, and equipment. This exposes us to certain environmental and pollution risks. Costs associated with compliance with Federal, State and local provisions regulating the discharge of materials or that otherwise relate to the protection of the environment have not had a material adverse effect on our capital expenditures, earnings, or competitive position. However, we cannot predict the likelihood of such a material adverse effect should we experience the occurrence of a future environmental or pollution event.
ITEM 1B. Unresolved Staff Comments
None.
ITEM 2. Properties
Our executive and administrative headquarters are located in a five-story building in Alexandria, Virginia, with approximately 95,000 square feet of office space leased by us through April 2027.
We own facilities located in an industrial park in Somerset, Pennsylvania that we use to conduct the operations of our Supply Chain Management Group. These properties consist of approximately 30 acres of land and buildings totaling approximately 239,000 square feet of office, engineering, and warehouse space.
We own two properties that we use to conduct the operations of our Aviation Group. We own and operate a property consisting of approximately one acre of land and a building with approximately 14,000 square feet of warehouse and office space in Miami, Florida. We own and operate a property consisting of a building with approximately 30,500 square feet of warehouse and office space in Independence, Kansas that is located on leased municipal airport land.
We own and operate two facilities in Ladysmith, Virginia. One of these properties consists of approximately 44 acres of land and multiple storage and vehicle maintenance buildings totaling approximately 56,000 square feet of space. The other property consists of 30 acres of land and buildings totaling approximately 13,500 square feet of space. We also own and operate two properties in Texarkana, Arkansas consisting of an aggregate of approximately 16 acres of land and buildings totaling approximately 114,000 square feet. We use these properties primarily to provide refurbishment services for military equipment, storage and maintenance.
We also provide services and products from facilities generally occupied under short-term leases primarily located near customer sites to facilitate communications and enhance program performance. As of December 31, 2016, we leased approximately 24 such facilities with a total of approximately 348,000 square feet of office and warehouse space. Our employees often provide services at customer facilities, limiting our requirement for additional space. We also provide services from locations outside of the United States, generally at foreign shipyards or U.S. military installations.
ITEM 3. Legal Proceedings
Anchorage Litigation and Related Proceedings
In March 2013, a lawsuit, Anchorage vs. Integrated Concepts and Research Corporation, et al., was filed in the Superior Court for the State of Alaska at Anchorage by the Municipality of Anchorage, Alaska (“MOA”) against our subsidiary Integrated Concepts and Research Corporation (“ICRC”) and two former subcontractors of ICRC (the “Anchorage Lawsuit”). The Anchorage Lawsuit asserted breach of contract, professional negligence and negligence in respect of services ICRC performed under its Port of Anchorage Intermodal Expansion Contract with the United States Maritime Administration. ICRC’s contract with the Maritime Administration expired in May 2012. In April 2013, the Anchorage Lawsuit was removed to the United States District Court for the District of Alaska.
In August 2015, a lawsuit, The Charter Oak Fire Insurance Company, The Travelers Indemnity Company of Connecticut and Travelers Property Casualty Company of America vs. Integrated Concepts and Research Corporation, VSE Corporation and Municipality of Anchorage, was filed against VSE and ICRC in the United States District Court for the District of Alaska (the “Coverage Lawsuit”). The plaintiff insurance companies were seeking (a) a declaration by the court that there was no defense or indemnity coverage available to ICRC and VSE for the Anchorage Lawsuit under the insurance policies issued by the plaintiffs and (b) reimbursement of legal fees and costs incurred by the plaintiffs in the defense of uncovered claims in respect of the Anchorage Lawsuit.
On or about January 25, 2017, ICRC, our insurers and MOA fully settled the Anchorage Lawsuit and Coverage Lawsuit. Pursuant to the settlements, ICRC and VSE were released from pending claims in the Anchorage Lawsuit and Coverage Lawsuit and ICRC and our insurers paid MOA approximately $3.8 million, of which $3.0 million was provided by our insurers. The United States District Court approved these lawsuit settlements in February 2017 and dismissed both lawsuits. See our discussion under "Results of Operations" in Part II, Item 7 below for a discussion of the financial effect of these settlements.
On or about September 9, 2016, ICRC filed a claim with the Civilian Board of Contract Appeals (“Board”) against the Maritime Administration for payment of contract closeout costs that were incurred by ICRC in respect of two Port of Anchorage Intermodal Expansion Contracts (the “Contracts”), and legal costs related to the Anchorage Lawsuit. On January 6, 2017, ICRC and the Maritime Administration agreed to a settlement, which the Board approved. Pursuant to the settlement, the U.S. Government paid ICRC $10.4 million in February 2017 in full satisfaction of the contract closeout costs, including interest and any legal costs
or damages arising out of ICRC’s work under the Contracts and the Anchorage Lawsuit. See our discussion under "Results of Operations" in Part II, Item 7 below for a discussion of the financial effect of this settlement.
Heritage Disposal Litigation
In February 2015, a lawsuit, Heritage Disposal & Storage, L.L.C. vs. VSE Corporation, was filed against VSE in the United States District Court for the District of Nebraska (the "Heritage Litigation"). On November 9, 2015, the Heritage Litigation was removed to the United States District Court for the Eastern District of Virginia. The complaint asserted that VSE had not fully paid Heritage for firework storage services rendered by Heritage during the period of October 2010 through August 2015 as a subcontractor under VSE's contract with the U.S. Bureau of Alcohol, Tobacco, Firearms and Explosives for the storage of fireworks seized by the Government. In June 2016, the jury in the Heritage Litigation awarded Heritage damages of approximately $4.8 million, exclusive of interest to be determined by the Court. On January 24, 2017, the United States District Court reduced the jury's award against VSE to approximately $3.5 million and denied Heritage’s request for prejudgment interest. On February 10, 2017, VSE and Heritage entered into an agreement in respect of the Heritage Litigation pursuant to which VSE paid approximately $3.3 million to Heritage in full settlement of the lawsuit.
During the course of the Heritage Litigation, VSE obtained evidence that invoices provided by Heritage under our predecessor contract with the U.S. Department of Treasury (the "Treasury Department") were possibly based on Heritage's improper inflation of the weight of certain seized fireworks stored by Heritage. We filed a voluntary disclosure of this matter with the Inspector General of the Treasury Department in June 2016. We estimated that the possible overbilling of the Government based on Heritage's improper inflation of the weight of seized fireworks stored by Heritage may be approximately $1.5 million. As a result of the United States District Court’s determination in the Heritage Litigation that the jury rejected that Heritage was engaged in a fraudulent billing scheme and that the Government was involved with the original weight estimates, we have determined that VSE did not overbill the Government. In February 2017 we notified the Government that we believe the voluntary disclosure matter is closed, but that we will continue to cooperate with the Government if it decides to continue investigating this matter.
Hawaii Litigation
In May 2012, four complaints were filed in the Circuit Court of the First Circuit, State of Hawaii, by the estates of five deceased individuals and certain of their relatives against VSE and certain other entities and individuals for unspecified damages. The complaints allege, among other things, that the explosion of fireworks and diesel fuel that injured and killed the five individuals in April 2011 was caused by negligence, actions and omissions of VSE and the other defendants and their employees, agents and representatives. The five deceased plaintiffs were employees of Donaldson Enterprises, Inc., which was a vendor retained by VSE to store and dispose of fireworks and other explosives seized by the federal government from entities and individuals illegally in possession of the fireworks and other explosives. VSE had a prime contract with the Treasury Department to support the management and disposal of seized assets, including fireworks and other explosives. VSE has denied the allegations and, together with its insurance carriers, will aggressively defend the proceedings, which are expected to proceed to trial in October 2017. While the results of legal proceedings cannot be predicted with certainty, we do not anticipate that this lawsuit will have a material adverse effect on our results of operations, financial condition, or cash flows.
Aviation Litigation
On or about November 30, 2016, a lawsuit, Arrieta et al. vs. Prime Turbines LLC et al., was filed in the District Court of Texas in Dallas County, by Edgar Arrieta, and four other plaintiffs against VSE's subsidiaries, Kansas Aviation of Independence, LLC (“Kansas Aviation”) and Prime Turbines LLC (“Prime”) and three other unrelated defendants. The other named defendants are Pratt & Whitney of Canada Corporation, Cessna Aircraft Company and Woodward Inc. The Plaintiffs allege that on April 1, 2016, a plane crashed in Mexico, resulting in the death of one plaintiff and serious injuries to two other plaintiffs. Plaintiffs allege that Kansas Aviation and Prime were negligent in providing maintenance, service and inspection of the airplane engine and/or component parts prior to the crash. Plaintiffs state they are seeking monetary relief over $1.0 million from the defendants. Trial is scheduled for May 2018. We have denied the allegations and, together with our insurance carrier, will aggressively defend the proceedings. While the results of legal proceedings cannot be predicted with certainty, we do not anticipate that this lawsuit will have a material adverse effect on our results of operation, financial condition, or cash flows.
In addition to the above-referenced legal proceedings, we may have certain claims in the normal course of business, including legal proceedings, against us and against other parties. In our opinion, the resolution of these other claims will not have a material adverse effect on our results of operations, financial position, or cash flows. However, the results of any legal proceedings cannot be predicted with certainty, therefore, the amount of loss, if any, cannot be reasonably estimated.
Further, from time-to-time, government agencies investigate whether our operations are being conducted in accordance with applicable contractual and regulatory requirements. Government investigations of us, whether relating to government contracts or conducted for other reasons, could result in administrative, civil or criminal liabilities, including repayments, fines or penalties being imposed upon us, or could lead to suspension or debarment from future government contracting. Government investigations often take years to complete and many result in no adverse action against us. We believe, based upon current information, that the outcome of any such government disputes and investigations will not have a material adverse effect on our results of operations, financial position, or cash flows.
ITEM 4. Mine Safety Disclosures
Not applicable.
ITEM 4(a). Executive Officers of Registrant
Our executive officers are listed below, as well as information concerning their age and positions held with VSE. There is no family relationships among any of our executive officers. The executive officers are appointed annually to serve until the first meeting of VSE's Board of Directors (the "Board") following the next annual meeting of stockholders and until their successors are elected and have qualified, or until death, resignation or removal, whichever is sooner.
|
| | | | |
Name | | Age | | Position with Registrant |
Joseph R. Brown | | 60 | | President, Federal Services Group |
Maurice A. Gauthier | | 69 | | Director, Chief Executive Officer, President and Chief Operating Officer |
Paul W. Goffredi | | 59 | | President, VSE's subsidiary VSE Aviation, Inc. |
Thomas M. Kiernan | | 49 | | Vice President, General Counsel and Secretary |
Thomas R. Loftus | | 61 | | Executive Vice President and Chief Financial Officer |
Nancy Margolis | | 61 | | President, VSE's subsidiary Energetics Incorporated and Akimeka LLC |
Chad Wheeler | | 42 | | President, VSE's subsidiary Wheeler Bros., Inc. |
Mr. Brown was appointed the President of the Federal Services Group in May 2015. Our Federal Services Group includes VSE's Global Maritime Services and Global Land Services divisions. Mr. Brown brings over 20 years of experience as a program and business unit manager at VSE. Mr. Brown leads a team whose primary focus is refurbishment services to extend and enhance the life of existing vehicles and equipment, fleet-wide ship and aircraft support, aircraft sustainment and maintenance, foreign military sales and other technical, management, engineering, logistics, maintenance, configuration management, prototyping, technology, and field support services to the U.S. Navy and Marine Corps, U.S. Army and Army Reserve, U.S. Air Force, and other U.S. and foreign military customers. Prior to joining VSE in 1996, Mr. Brown served 20 years active duty in the U.S. Navy. He earned a Bachelor of Business Administration from University of Maryland University College and an Associate of Science in Mechanical Engineering from the University of Tennessee at Knoxville.
Mr. Gauthier has served as VSE's Chief Executive Officer, President and Chief Operating Officer since April 2008, and has served as a Board member since February 2009.
Mr. Goffredi has served as President and Chief Operating Officer of our subsidiary VSE Aviation, Inc. since January 2015, when VSE Aviation, Inc. acquired Prime Turbines LLC (including both U.S. and Germany-based operations), CT Aerospace LLC, Kansas Aviation of Independence, L.L.C. and Air Parts & Supply Co. (collectively, "the Aviation Acquisition"). His focus and background includes business development, strategic OEM and major customer relations, supply chain management, engine and material acquisition, and operational excellence and improvement. Prior to joining VSE, Mr. Goffredi served for three years as Chief Operating Officer for Killick Aerospace, and 13 years with BBA Aviation as Program Director for all Honeywell Engine Programs. Mr. Goffredi received a degree in Business Administration from Mesa State College (Colorado) and holds an MBA in Marketing and Finance from The University of St. Thomas (Texas).
Mr. Kiernan has served as VSE's Vice President, General Counsel and Secretary since November 2008.
Mr. Loftus has served as VSE's Chief Financial Officer and Executive Vice President since March 2002. Mr. Loftus has served in various roles of increasing responsibility at VSE since 1978, and served as VSE's Comptroller, Senior Vice President and Corporate Tax Director from March 1999 to February 2002.
Ms. Margolis has served as the President of Energetics Incorporated since May 2013. She previously served as the Vice President of the Energetics Science and Technology Division from October 1984 to May 2013.
Mr. Wheeler has served as President and Chief Operating Officer of Wheeler Bros., Inc. ("WBI") since July 2013. Since 1991, Mr. Wheeler has served in various roles at WBI, including Senior Vice President of Operations, Senior Vice President of Sales and Marketing, and Marketing and Sales Manager. While serving as Marketing and Sales Manager, Mr. Wheeler coordinated implementation of WBI's Managed Inventory Program which is used at the USPS' Vehicle Maintenance Facilities throughout the country. Mr. Wheeler graduated summa cum laude from Indiana University of Pennsylvania in 1998 with a degree in Marketing.
PART II
ITEM 5. Market for Registrant's Common Equity, Related Stockholder Matters and Issuer Purchases of Equity Securities
(a)Market Information
VSE common stock, par value $0.05 per share, is traded on The NASDAQ Global Select Market, trading symbol, "VSEC," Newspaper listing, "VSE."
In May 2016, our Board approved a two-for-one stock split effected in the form of a stock dividend ("Stock Split"). The Stock Split had a record date of July 20, 2016 and stock distribution occurred on August 3, 2016. All share and per share amounts have been adjusted to give retroactive effect to the increased number of shares of common stock outstanding due to the Stock Split.
The following table sets forth the range of high and low sales price (based on information reported by The NASDAQ Global Select Market) and cash dividend per share information for our common stock for each quarter and annually during the last two years. Sales prices and cash dividend per share information have been adjusted for the Stock Split.
|
| | | | | | | | | | | | |
Quarter Ended | | High | | Low | | Dividends |
2015: | | | | | | |
March 31 | | $ | 42.03 |
| | $ | 31.50 |
| | $ | 0.050 |
|
June 30 | | 41.95 |
| | 26.16 |
| | 0.055 |
|
September 30 | | 27.68 |
| | 16.76 |
| | 0.055 |
|
December 31 | | 33.93 |
| | 19.04 |
| | 0.055 |
|
For the Year | | $ | 42.03 |
| | $ | 16.76 |
| | $ | 0.215 |
|
| | | | | | |
2016: | | |
| | |
| | |
|
March 31 | | $ | 35.60 |
| | $ | 26.38 |
| | $ | 0.055 |
|
June 30 | | 35.98 |
| | 30.86 |
| | 0.060 |
|
September 30 | | 38.23 |
| | 29.94 |
| | 0.060 |
|
December 31 | | 42.69 |
| | 26.16 |
| | 0.060 |
|
For the Year | | $ | 42.69 |
| | $ | 26.16 |
| | $ | 0.235 |
|
(b)Holders
As of February 1, 2017, VSE common stock, par value $0.05 per share, was held by approximately 227 stockholders of record. The number of stockholders of record is not representative of the number of beneficial holders because many of VSE's shares are held by depositories, brokers or nominees.
(c)Dividends
In 2015 cash dividends were declared quarterly at the annual rate of $0.20 per share through March 31, 2015, and at the annual rate of $0.22 per share commencing June 1, 2015.
In 2016 cash dividends were declared quarterly at the annual rate of $0.22 per share through March 31, 2016, and at the annual rate of $0.24 per share commencing June 1, 2016.
Pursuant to our bank loan agreement (see Note 7, Debt, of "Notes to Consolidated Financial Statements" in Item 8 of this Form 10-K), the payment of cash dividends is subject to annual rate restrictions. We have paid cash dividends each year since 1973 and have increased our dividend each year since 2004.
(d)Certain Sales and Repurchases of VSE Common Stock
During the fiscal year covered by this Form 10-K, VSE did not sell any of its equity securities that were not registered under the Securities Act of 1933, as amended. During the fourth quarter of the fiscal year covered by this Form 10-K, no purchases of equity securities of VSE were made by or on behalf of VSE or any "affiliated purchaser" (as defined in Exchange Act Rule 10b-18 (a)(3)) other than 15,636 shares of our restricted common stock that were voluntarily forfeited to VSE by participants in its 2006 Restricted Stock Plan to cover their personal tax liability for restricted stock awards.
(e)Equity Compensation Plan Information
We have two compensation plans approved by our stockholders under which our equity securities are authorized for issuance to employees and directors: (i) the VSE Corporation 2004 Non-Employee Directors Stock Plan and (ii) the VSE Corporation 2006 Restricted Stock Plan.
As of December 31, 2016, 132,569 shares of VSE common stock were available for future issuance under the VSE Corporation 2004 Non-Employee Directors Stock Plan and 476,140 shares of VSE common stock were available for future issuance under the VSE Corporation 2006 Restricted Stock Plan.
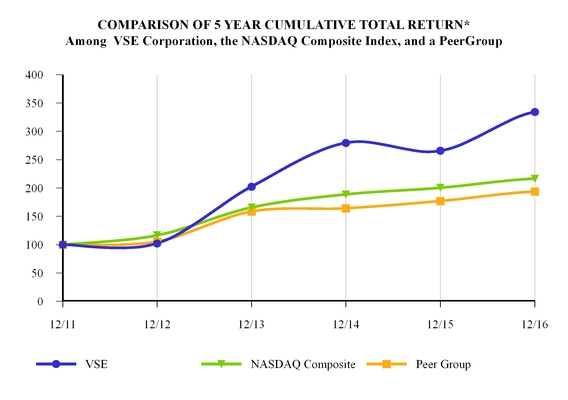
Performance Graph
Set forth below is a line graph comparing the cumulative total return of VSE common stock with (a) a performance index for the broad market (The NASDAQ Global Select Market) on which VSE common stock is traded and (b) a published industry index. VSE common stock is traded on The NASDAQ Global Select Market, and our industry group is engineering and technical services (formerly SIC Code 8711). Accordingly, the performance graph compares the cumulative total return for VSE common stock with (a) an index for The NASDAQ Global Select Market (U.S. companies) ("NASDAQ Index") and (b) our peer group.
*$100 invested on 12/31/11 in stock or index, including reinvestment of dividends.
Fiscal year ending December 31.
Performance Graph Table
|
| | | | | | | | | | | |
| 2011 | | 2012 | | 2013 | | 2014 | | 2015 | | 2016 |
VSE | 100 | | 102.24 | | 202.28 | | 279.52 | | 265.58 | | 334.15 |
NASDAQ Composite | 100 | | 116.41 | | 165.47 | | 188.69 | | 200.32 | | 216.54 |
Peer Group | 100 | | 105.54 | | 158.42 | | 164.29 | | 177.03 | | 193.76 |
ITEM 6. Selected Financial Data
(in thousands, except per share data)
|
| | | | | | | | | | | | | | | | | | | |
| Years ended December 31, |
| 2016 | | 2015 | | 2014 | | 2013 | | 2012 |
| | | | | | | | | |
Revenues | $ | 691,790 |
| | $ | 533,982 |
| | $ | 424,071 |
| | $ | 471,638 |
| | $ | 546,755 |
|
| | | | | | | | | |
Income from continuing operations | $ | 26,793 |
| | $ | 24,918 |
| | $ | 20,489 |
| | $ | 23,990 |
| | $ | 27,364 |
|
Loss from discontinued operations | — |
| | — |
| | (1,124 | ) | | (1,138 | ) | | (6,070 | ) |
Net income | $ | 26,793 |
| | $ | 24,918 |
| | $ | 19,365 |
| | $ | 22,852 |
| | $ | 21,294 |
|
| | | | | | | | | |
Basic earnings per share: | | | | | | | | | |
Income from continuing operations | $ | 2.48 |
| | $ | 2.32 |
| | $ | 1.91 |
| | $ | 2.25 |
| | $ | 2.59 |
|
Loss from discontinued operations | — |
| | — |
| | (0.10 | ) | | (0.11 | ) | | (0.58 | ) |
Net income | $ | 2.48 |
| | $ | 2.32 |
| | $ | 1.81 |
| | $ | 2.14 |
| | $ | 2.01 |
|
| | | | | | | | | |
Diluted earnings per share: | | | | | | | | | |
Income from continuing operations | $ | 2.47 |
| | $ | 2.31 |
| | $ | 1.91 |
| | $ | 2.25 |
| | $ | 2.58 |
|
Loss from discontinued operations | — |
| | — |
| | (0.10 | ) | | (0.11 | ) | | (0.57 | ) |
Net income | $ | 2.47 |
| | $ | 2.31 |
| | $ | 1.81 |
| | $ | 2.14 |
| | $ | 2.01 |
|
| | | | | | | | | |
Cash dividends per common share | $ | 0.235 |
| | $ | 0.215 |
| | $ | 0.195 |
| | $ | 0.175 |
| | $ | 0.155 |
|
|
| | | | | | | | | | | | | | | | | | | |
| As of December 31, |
| 2016 | | 2015 | | 2014 | | 2013 | | 2012 |
| | | | | | | | | |
Working capital | $ | 110,021 |
| | $ | 100,780 |
| | $ | 33,037 |
| | $ | 46,828 |
| | $ | 64,209 |
|
| | | | | | | | | |
Total assets | $ | 661,839 |
| | $ | 617,354 |
| | $ | 353,430 |
| | $ | 380,077 |
| | $ | 409,572 |
|
| | | | | | | | | |
Long-term debt | $ | 193,621 |
| | $ | 215,243 |
| | $ | 23,483 |
| | $ | 64,221 |
| | $ | 115,924 |
|
| | | | | | | | | |
Long-term lease obligations | $ | 21,959 |
| | $ | 23,251 |
| | $ | 24,584 |
| | $ | 25,721 |
| | $ | 27,435 |
|
| | | | | | | | | |
Stockholders' equity | $ | 255,194 |
| | $ | 229,309 |
| | $ | 205,489 |
| | $ | 186,803 |
| | $ | 164,335 |
|
This consolidated summary of selected financial data should be read in conjunction with Management's Discussion and Analysis of the Financial Condition and Results of Operations included in Item 7 of this Form 10-K and with the Consolidated Financial Statements and related Notes included in Item 8 of this Form 10-K. The historical results set forth in this Item 6 are not necessarily indicative of the results of operations to be expected in the future.
ITEM 7. Management’s Discussion and Analysis of Financial Condition and Results of Operations
Executive Overview
Customers and Services
We are a diversified services and supply chain management company that assists our clients in sustaining, extending the service life, and improving the performance of their transportation, equipment, and other assets and systems. We provide logistics and distribution services for legacy systems and equipment and professional and technical services to the United States Government (the "government"), including the United States Department of Defense ("DoD"), the United States Postal Service ("USPS"), federal civilian agencies, and to commercial and other customers. Our largest customers are the DoD and the USPS. Our operations include supply chain management solutions, parts supply and distribution, and maintenance, repair, and overhaul (“MRO”) services for vehicle fleet, aviation, and other clients; vehicle and equipment maintenance and refurbishment; logistics; engineering; energy and environmental services; IT and health care IT solutions; and consulting services. See Item 1 “Business - Revenues and Contracts” above for revenues by customer.
Organization and Segments
Our operations are conducted within four reportable segments aligned with our management groups: 1) Supply Chain Management; 2) Aviation; 3) Federal Services; and 4) IT, Energy and Management Consulting. Beginning in 2017, we are consolidating our Federal Services Group and IT, Energy and Management Consulting Group into a single management group and reportable segment.
Supply Chain Management Group - Our Supply Chain Management Group provides sourcing, acquisition, scheduling, transportation, shipping, logistics, data management, and other services to assist our clients with supply chain management efforts. This group consists of our subsidiaries Wheeler Bros., Inc. ("WBI") and Ultra Seating Company. The primary revenue source for this group is WBI's USPS Managed Inventory Program ("MIP") that supplies vehicle parts and mission critical supply chain support for the USPS truck fleet. Other current work efforts include managed inventory services and parts sales to support commercial client truck fleets, parts sales to DoD, and other projects to support the USPS.
Aviation Group - Our Aviation Group provides MRO services, parts supply and distribution, and supply chain solutions for general aviation jet aircraft engines and engine accessories. This group consists of VSE Aviation, Inc. and the four aviation businesses we acquired in January 2015. These businesses have a diversified client base serving corporate and private aircraft owners, regional airlines, aviation manufacturers, other aviation MRO providers, cargo transporters, and agricultural clients.
Federal Services Group - Our Federal Services Group provides foreign military sales services, refurbishment services to extend and enhance the life of existing vehicles and equipment, fleet-wide ship and aircraft support, aircraft sustainment and maintenance, and other technical, management, engineering, logistics, maintenance, configuration management, prototyping, technology, and field support services to the U.S. Navy and Marine Corps, U.S. Army and Army Reserve, U.S. Air Force, and other customers. Significant work efforts for this group include assistance to the U.S. Navy in executing its Foreign Military Sales (“FMS”) Program for surface ships sold, leased or granted to foreign countries, our Red River Army Depot Equipment Related Services Program (“RRAD ERS”) providing on-site logistics support for Red River Army Depot at Texarkana, Texas, our Fort Benning Logistics Support Services Program supporting base operations and logistics at Fort Benning, Georgia, and various vehicle and equipment refurbishment, maintenance and sustainment programs for U.S. Army commands.
IT, Energy and Management Consulting Group - Our IT, Energy and Management Consulting Group provides technical and consulting services primarily to various DoD and federal civilian agencies, including the United States Departments of Energy, Homeland Security, and Interior; the Social Security Administration; the National Institutes of Health; customers in the military health system; and other government agencies and commercial clients. This group consists of our subsidiaries Energetics Incorporated ("Energetics") and Akimeka, LLC ("Akimeka"). Energetics provides technical, policy, business, and management support in areas of energy modernization, clean and efficient energy, climate change mitigation, infrastructure protection, and measurement technology. Akimeka offers solutions in fields that include medical logistics, medical command and control, e-health, information assurance, public safety, enterprise architecture development, business continuity, program and portfolio management, network IT services, cloud managed services, systems design and integration, quality assurance services, and product and process improvement services.
Concentration of Revenues
|
| | | | | | | | | | | | | | | | | | |
|
| (in thousands) Years ended December 31, |
Source of Revenues | | 2016 | | % | | 2015 | | % | | 2014 | | % |
USPS | | $ | 181,215 |
| | 26 | | $ | 184,876 |
| | 35 | | $ | 167,268 |
| | 40 |
FMS Program | | 169,754 |
| | 25 | | 76,476 |
| | 14 | | 86,399 |
| | 20 |
Other | | 340,821 |
| | 49 | | 272,630 |
| | 51 | | 170,404 |
| | 40 |
Total Revenues | | $ | 691,790 |
| | 100 | | $ | 533,982 |
| | 100 | | $ | 424,071 |
| | 100 |
Management Outlook
We saw steady revenue growth in 2016, as revenue increased on a quarter to quarter basis throughout the year and was up 30% over the prior year. The improvements in our revenue levels were led by renewed vigor in our Federal Services Group markets, for which revenues increased by 83%. Strong contract funding awards in 2016 allowed us to finish the year with a contract funded backlog that positions us well as we head into 2017. Increased revenues from our Supply Chain Management Group and a full year of revenue from our Aviation Group (as compared to eleven months in 2015 when we acquired these businesses) also contributed to our revenue growth in 2016.
We are encouraged to see contributions to our Federal Services Group revenue base from both our long time programs and newer programs. Activity on our FMS Program has increased over the past year, including work to transfer two frigates to Taiwan and equipment supply services to U.S. Navy foreign client countries. Our equipment refurbishment services for U.S. Army Reserve transportation equipment and other assets continue to be a key service offering to this legacy customer. Our newer programs enhancing revenue growth include our RRAD ERS Program, started in May 2016, and our Fort Benning Logistics Support Services Program, started in August 2015. These four programs, including a full year of revenue on our RRAD ERS Program in 2017, as well as additional smaller new work efforts, provide our Federal Services Group with a solid revenue base. Contract funding increases resulted in bookings of $458 million in 2016 and contract funded backlog of $322 million for our federal contracting businesses as of the end 2016, which will help sustain our 2017 federal contracting revenues. Additionally, we have developed strong international business relationships through our decades of work with foreign client countries. We are extending these relationships to market our services to several international clients.
Revenues for our Supply Chain Management Group have increased in 2016 at more modest levels than the previous two years. Although our vehicle parts supply and inventory management support for the USPS delivery vehicle fleet continue to be the primary drivers of this group’s successful results, 2016 revenue growth for this group has been provided by greater diversification and growth of parts sales to the DoD, increased supply chain and inventory management support for commercial vehicle fleets, and revenue from our acquisition of Ultra Seating Company in December 2015. We continue to broaden our base of commercial clients and make progress toward capturing new commercial vehicle fleet clients.
We are a key partner with the USPS and our mission critical supply chain support should continue to be essential in sustaining the aging USPS fleet as this client embarks on a lengthy procurement process to acquire a new class of delivery vehicles to both augment and replace older vehicles. The USPS anticipates the first deployment of a small number of newly produced vehicles will occur in three or four years. At that point in time, production and procurement of vehicles will be scheduled to occur annually over a seven-year period. USPS' previously published vehicle procurement time lines continue to experience changes and delays. Based on the size, scope, and complexity of USPS' new vehicle procurement strategy, we cannot be certain of the timing and quantities of new vehicles to be deployed. We also cannot determine the timing or number of existing delivery vehicles that will be redeployed for other routes or purposes.
While we will not participate in the competition to provide new vehicles, we will be seeking to participate with the selected providers to offer original content, program management, and warranty support. Aftermarket parts supply and supply chain services to support the USPS' newly acquired vehicles will be part of our model in addition to continuing our support for older USPS vehicles that remain in service. In 2016 the USPS disclosed that 1.1 million addresses were added to their delivery network and shipping and packaging volume increased by half a billion items in 2015, all contributing to an increased requirement for delivery capacity which may require a combination of both old and new vehicles for longer than currently planned. While we cannot predict with certainty the impact on our future revenues once the USPS new delivery vehicle procurement begins, we believe that our years of service and knowledge of this client’s needs strategically position us to participate in providing parts supply and supply chain services for newly procured vehicles and to offer total parts availability for existing older vehicles that remain in service.
Our Aviation Group contributed approximately 19% of our revenues and is a significant part of our strategy to expand our markets for sustainment services, while diversifying our customer and revenue base and strengthening growth potential. This group has provided us with a wide range of new clients, competencies and key industry relationships that offer potential synergies as we seek to extend these service offerings to our traditional U.S. and international military client base. Revenue and operating income for this group may experience fluctuations due to market demand and the mix of products sold.
As 2016 ended and 2017 began, we settled several pending litigation matters, as discussed above in Item 3. "Legal Proceedings." In January 2017, we settled the Anchorage Lawsuit, a related insurance coverage lawsuit, and our claim against the U.S. Maritime Administration. These matters were associated with our ICRC subsidiary's contract work with the U.S. Maritime Administration that ended in 2012. These settlements include our release from related claims and the finalization of our contract close-out with the U.S. Maritime Administration which included a payment to ICRC for unreimbursed contract work and certain legal costs. The net benefit to our operating income for the year ended December 31, 2016 resulting primarily from the contract close-out is approximately $1.4 million. Also in February 2017, we settled the Heritage Litigation discussed above in Item 3, which reduced 2016 operating income by approximately $3.3 million.
Bookings and Funded Backlog
Revenues for government contract work performed by our Federal Services and IT, Energy and Management Consulting groups depend on contract funding (“bookings”), and bookings generally occur when contract funding documentation is received. Funded contract backlog is an indicator of potential future revenue for these groups. While bookings and funded contract backlog generally result in revenue, we may occasionally have funded contract backlog that expires or is de-obligated upon contract completion and does not generate revenue.
A summary of our bookings and revenues for our Federal Services and IT, Energy and Management groups for the years ended December 31, 2016, 2015 and 2014, and funded contract backlog for these groups as of December 31, 2016, 2015 and 2014 is as follows (in millions):
|
| | | | | | | | | | | |
| 2016 | | 2015 | | 2014 |
Bookings | $ | 458 |
| | $ | 281 |
| | $ | 217 |
|
Revenues | $ | 353 |
| | $ | 217 |
| | $ | 252 |
|
Funded Backlog | $ | 322 |
| | $ | 238 |
| | $ | 193 |
|
Recently Issued Accounting Pronouncements
For a description of recently announced accounting standards, including the expected dates of adoption and estimated effects, if any, on our consolidated financial statements, see "Recently Issued Accounting Pronouncements" in Note 1 of the Notes to our Consolidated Financial Statements in this Form 10-K.
Critical Accounting Policies
Our consolidated financial statements are prepared in accordance with accounting principles generally accepted in the United States, which require us to make estimates and assumptions. We believe the following critical accounting policies affect the more significant accounts, particularly those that involve judgments, estimates and assumptions used in the preparation of our consolidated financial statements.
Revenue Recognition
Revenue is recognized when persuasive evidence of an arrangement exists, delivery has occurred or services have been rendered, the fee is fixed or determinable, and collection is probable.
Substantially all of our Supply Chain Management Group revenues result from the sale of vehicle parts to clients. We recognize revenue from the sale of vehicle parts when the customer takes ownership of the parts.
Our Aviation Group revenues are recognized upon the shipment or delivery of products to customers based on when title or risk of loss transfers to the customer. Sales returns and allowances are not significant.
Substantially all of our Federal Services and IT, Energy and Management Consulting work is performed for our customers on a contract basis. The three primary types of contracts used are cost-type, fixed-price and time and materials. Revenues result from work performed on these contracts by our employees and our subcontractors and from costs for materials and other work related costs allowed under our contracts.
Revenues on cost-type contracts are recorded as contract allowable costs are incurred and fees are earned. Our FMS Program contract is a cost plus award fee contract. This contract has terms that specify award fee payments that are determined by performance and level of contract activity. Award fees are made during the year through a contract modification authorizing the award fee that is issued subsequent to the period in which the work is performed. We recognize award fee income on the FMS Program contract when the fees are fixed or determinable. Due to such timing and fluctuations in the level of revenues, profits as a percentage of revenues on this contract will fluctuate from period to period.
Revenue recognition methods on fixed-price contracts will vary depending on the nature of the work and the contract terms. Revenues on fixed-price service contracts are recorded as work is performed, typically ratably over the service period. Revenues on fixed-price contracts that require delivery of specific items are recorded based on a price per unit as units are delivered.
Revenues for time and materials contracts are recorded on the basis of contract allowable labor hours worked multiplied by the contract defined billing rates, plus the direct costs and indirect cost burdens associated with materials and subcontract work used in performance on the contract. Generally, profits on time and materials contracts result from the difference between the cost of services performed and the contract defined billing rates for these services.
A summary of revenues for our operating groups, including a summary by contract type for our Federal Services and IT, Energy and Management Consulting groups, for the years ended December 31 is presented below (in thousands).
|
| | | | | | | | | | | | | | | | | |
Contract Type | 2016 Revenues | | % | | 2015 Revenues | | % | | 2014 Revenues | | % |
Cost-type | $ | 207,047 |
| | 29.9 | | $ | 100,447 |
| | 18.8 | | $ | 120,915 |
| | 28.5 |
Fixed-price | 75,213 |
| | 10.9 | | 74,490 |
| | 13.9 | | 87,807 |
| | 20.7 |
Time and materials | 70,589 |
| | 10.2 | | 42,544 |
| | 8.0 | | 42,867 |
| | 10.1 |
Total Federal Services and IT, Energy and Management Consulting revenues | 352,849 |
| | 51.0 | | 217,481 |
| | 40.7 | | 251,589 |
| | 59.3 |
| | | | | | | | | | | |
Supply Chain Management and Aviation revenues | 338,941 |
| | 49.0 | | 316,501 |
| | 59.3 | | 172,482 |
| | 40.7 |
Total revenues | $ | 691,790 |
| | 100.0 | | $ | 533,982 |
| | 100.0 | | $ | 424,071 |
| | 100.0 |
We will occasionally perform work at risk, which is work performed prior to formalizing contract funding for such work. Revenue related to work performed at risk is not recognized until it can be reliably estimated and its realization is probable. We recognize this “risk funding” as revenue when the associated costs are incurred or the work is performed. We are at risk of loss for any risk funding not received. Revenues recognized as of December 31, 2016 include approximately $2.1 million for which we have not received formalized funding. We believe that we are entitled to reimbursement and expect to receive all of this funding.
Goodwill and Intangible Assets
We have five reporting units, including four reporting units with goodwill. Goodwill is subject to a review for impairment at least annually. We perform an annual review of goodwill for impairment during the fourth quarter and whenever events or changes in circumstances indicate that the carrying value may not be recoverable. The impairment assessment requires us to estimate the fair value of our reporting units and involves the use of subjective assumptions.
We estimated the fair value of our reporting units using a weighting of fair values derived from the income approach, market approach, and comparative transactions approach with the heaviest weighting placed on the income approach. Under the income approach, we calculate the fair value of a reporting unit based on the present value of estimated future cash flows. Cash flow projections are based on our estimates of revenue growth rates and operating margins, taking into consideration industry and market conditions. The discount rate used is based on a weighted average cost of capital adjusted for the relevant risk associated with the characteristics of the business and the projected cash flows.
In the fourth quarter of 2016, we performed our annual goodwill impairment analysis for each of our reporting units with goodwill. The results of the impairment analysis indicated that our reporting units had fair values substantially in excess of their carrying values with the exception of our Akimeka and Aviation reporting units.
The fair value of our Akimeka reporting unit within our IT, Energy, and Management Consulting Group exceeded its carrying value by approximately 7%. Akimeka experienced a reduction in services performed in 2015 as compared to prior years due to a decline in services ordered by clients on contracts and a loss of work performed on expiring contracts for which the follow-on work was often awarded to small businesses as set-aside contracts. Revenues and profit margins have remained level on a quarter to quarter basis during 2016 as compared to 2015. Based on our assessment of these circumstances, we have determined that Akimeka will be at risk of a future goodwill impairment if there is further deterioration of projected cash flows or negative changes in market factors. The carrying value of our Akimeka reporting unit included goodwill of approximately $29.8 million as of December 31, 2016.
The fair value of our Aviation reporting unit within our Aviation Group exceeded its carrying value by approximately 10%. The margin between the carrying value and fair value is due to the proximity of the goodwill impairment testing date to the acquisition date of January 28, 2015. We do not believe our Aviation reporting unit is at risk of future goodwill impairment as this reporting unit's performance has been consistent since acquisition. If our projections of future operating income were to decline, the estimated fair value of the reporting unit could be adversely affected, leading to a potential impairment in a future period. The carrying value of our Aviation reporting unit included goodwill of approximately $104.5 million as of December 31, 2016.
As of December 31, 2016, we have no intangible assets with indefinite lives and we had an aggregate of approximately $199 million of goodwill associated with our acquisitions.
Results of Operations
|
| | | | | | | | | | | | | | | | | |
| Revenues (in thousands) Years ended December 31, |
| 2016 | | % | | 2015 | | % | | 2014 | | % |
Supply Chain Management Group | $ | 205,475 |
| | 29.7 | | $ | 196,772 |
| | 36.8 | | $ | 172,482 |
| | 40.7 |
Aviation Group | 133,466 |
| | 19.3 | | 119,729 |
| | 22.4 | | — |
| | — |
Federal Services Group | 306,109 |
| | 44.2 | | 166,973 |
| | 31.3 | | 190,761 |
| | 45.0 |
IT, Energy and Management Consulting Group | 46,740 |
| | 6.8 | | 50,508 |
| | 9.5 | | 60,828 |
| | 14.3 |
| $ | 691,790 |
| | 100.0 | | $ | 533,982 |
| | 100.0 | | $ | 424,071 |
| | 100.0 |
Our revenues increased by approximately $158 million or 30% for the year ended December 31, 2016 as compared to the prior year. The change in revenues for this period resulted from an increase in our Federal Services Group of approximately $139 million, an increase in our Aviation Group of approximately $14 million, an increase in our Supply Chain Management Group of approximately $9 million, and a decrease in our IT, Energy, and Management Consulting Group of approximately $4 million.
Our revenues increased by approximately $110 million or 26% for the year ended December 31, 2015 as compared to the prior year. The change in revenues for this period resulted from an increase of approximately $120 million due to the inclusion our Aviation Group in our operating results in 2015, an increase in our Supply Chain Management Group of approximately $24 million, a decrease in our Federal Services Group of approximately $24 million, and a decrease in our IT, Energy, and Management Consulting Group of approximately $10 million.
|
| | | | | | | | | | | | | | | | | | | | |
| Consolidated Statements of Income (in thousands) Years ended December 31, |
| 2016 | | % | | 2015 | | % | | 2014 | | % |
Revenues | $ | 691,790 |
| | 100.0 |
| | $ | 533,982 |
| | 100.0 |
| | $ | 424,071 |
| | 100.0 |
|
Costs and operating expenses | 640,261 |
| | 92.6 |
| | 483,443 |
| | 90.5 |
| | 387,141 |
| | 91.3 |
|
Operating income | 51,529 |
| | 7.4 |
| | 50,539 |
| | 9.5 |
| | 36,930 |
| | 8.7 |
|
Interest expense, net | 9,855 |
| | 1.4 |
| | 9,544 |
| | 1.8 |
| | 3,983 |
| | 0.9 |
|
Income from continuing operations before income taxes | 41,674 |
| | 6.0 |
| | 40,995 |
| | 7.7 |
| | 32,947 |
| | 7.8 |
|
Provision for income taxes | 14,881 |
| | 2.1 |
| | 16,077 |
| | 3.0 |
| | 12,458 |
| | 3.0 |
|
Income from continuing operations | 26,793 |
| | 3.9 |
| | 24,918 |
| | 4.7 |
| | 20,489 |
| | 4.8 |
|
Loss from discontinued operations, net of tax | — |
| | — |
| | — |
| | — |
| | (1,124 | ) | | (0.2 | ) |
Net income | $ | 26,793 |
| | 3.9 |
| | $ | 24,918 |
| | 4.7 |
| | $ | 19,365 |
| | 4.6 |
|
Costs and operating expenses consist primarily of cost of inventory and delivery of our products sold; direct costs, including labor, material, and supplies used in the performance of our contract work; indirect costs associated with our direct contract costs; sales, general, and administrative expenses associated with our operating groups and corporate management; and certain costs and charges arising from nonrecurring events outside the ordinary course of business. These costs will generally increase or decrease in conjunction with our level of products sold or contract work performed. Costs and operating expenses also include expense for amortization of intangible assets acquired through our acquisitions. Expense for amortization of acquisition related intangible assets is included in the segment results in which the acquisition is included. Segment results also include expense for an allocation of corporate management costs.
Our costs and operating expenses increased by approximately $157 million or 32% in 2016 as compared to 2015. The change in costs and operating expenses resulted primarily from an increase in our Federal Services Group of approximately $137 million, an increase in our Aviation Group of approximately $12 million, an increase in our Supply Chain Management Group of approximately $10 million, and a decrease in our IT, Energy, and Management Consulting Group of approximately $3 million.
Our costs and operating expenses increased by approximately $96 million or 25% in 2015 as compared to 2014. The change in costs and operating expenses resulted primarily from an increase of approximately $109 million due to the inclusion our Aviation Group in our operating results, an increase in our Supply Chain Management Group of approximately $19 million, a decrease in our Federal Services Group of approximately $22 million, and a decrease in our IT, Energy, and Management Consulting Group of approximately $8 million.
Our operating income increased by approximately $1.0 million or 2% in 2016 as compared to 2015. The change in operating income resulted primarily from changes in our operating group results, and settlement of our Anchorage Lawsuit and a related insurance carrier lawsuit, our claim against the U.S. Maritime Administration (the "MARAD Claim"), and the Heritage Litigation. Operating group results included operating income increases for our Federal Services Group of approximately $2.1 million and for our Aviation Group of approximately $2.2 million, and operating income decreases for our IT, Energy, and Management Consulting Group of approximately $1.1 million and for our Supply Chain Management Group of approximately $821 thousand. Our increase in revenue allowed us to spread our corporate infrastructure costs over a larger revenue base, which benefited our operating group income. The combined effect of the settlements of the Anchorage Lawsuit, related insurance carrier lawsuit, and MARAD Claim resulted in an increase in operating income of approximately $1.4 million for 2016. The settlement of the Heritage Litigation resulted in a decrease in operating income of approximately $3.3 million, which consisted of recorded expenses of $1.2 million in the second quarter and $2.1 million in the fourth quarter of 2016. See Item 3. "Legal Proceedings" above for further discussion of the Anchorage Lawsuit and related insurance carrier lawsuit, MARAD Claim, and Heritage Litigation.
Our operating income increased by approximately $13.6 million or 37% in 2015 as compared to 2014. The increase resulted primarily from an increase of approximately $10.6 million due to the inclusion our Aviation Group in our operating results in 2015, an increase in our Supply Chain Management Group of approximately $5.8 million, a decrease in our Federal Services Group of approximately $1.4 million, and a decrease in our IT, Energy, and Management Consulting Group of approximately $1.9 million.
Interest expense increased approximately $311 thousand in 2016 as compared to 2015, as our bank debt levels remained steady for most of the year. Interest expense increased approximately $5.6 million in 2015 as compared to 2014, primarily due to an increase in borrowing to finance our Aviation Acquisition. Interest expense also includes interest related to our executive and administrative headquarters facility lease. The amount of interest expense associated with capital leases is approximately $1.6 million, $1.6 million and $1.7 million for 2016, 2015 and 2014, respectively.
Provision for Income Taxes
Our effective tax rate from continuing operations was 35.7% for 2016, 39.2% for 2015, and 37.8% for 2014. Our tax rate is affected by discrete items that may occur in any given year, but may not be consistent from year to year. In addition to state income taxes, certain tax credits and other items can impact the difference between our statutory U.S. Federal income tax rate of 35% and our effective tax rate. Our effective tax rate for 2016 was reduced due to fair value changes of approximately $1.3 million to our Aviation Acquisition earn-out obligation. Approximately $900 thousand of transaction costs associated with our Aviation Acquisition that were not deductible for tax purposes resulted in an increase to our effective tax rate for 2015. Other permanent differences and federal and state tax credits such as the work opportunity tax credit and a state educational improvement tax credit provided benefit to our tax rates for 2016, 2015 and 2014.
Supply Chain Management Group Results
The results of operations for our Supply Chain Management Group are (in thousands):
|
| | | | | | | | | | | | | | | | | | |
| Years ended December 31, |
| 2016 | | % | | 2015 | | % | | 2014 | | % |
Revenues | $ | 205,475 |
| | 100.0 |
| | $ | 196,772 |
| | 100.0 | | $ | 172,482 |
| | 100.0 |
Costs and operating expenses | 170,843 |
| | 83.1 |
| | 161,319 |
| | 82.0 | | 142,788 |
| | 82.8 |
Operating income | $ | 34,632 |
| | 16.9 |
| | $ | 35,453 |
| | 18.0 | | $ | 29,694 |
| | 17.2 |
Revenues for our Supply Chain Management Group increased approximately $9 million or 4% for 2016, as compared to the prior year. The revenue increase resulted primarily from an increase in sales to government and commercial customers of approximately $10.9 million, including sales of approximately $3.3 million from Ultra Seating Company, which we acquired in December 2015. Costs and operating expenses for our Supply Chain Management Group increased approximately $10 million or 6% and operating income decreased by approximately $821 thousand or 2% for 2016 as compared to the prior year. The increase in costs and operating expenses resulted primarily from an increase in products sold. The products sold associated with our increasing government and commercial customer revenues tends to lower our overall profit margins as our revenue mix changes. The decrease in operating income was primarily attributable to market competition and a change in the mix of products sold, and to increased costs associated with investments to support revenue growth.
Revenues for our Supply Chain Management Group increased approximately $24 million or 14% for 2015, as compared to the prior year. The revenue increase resulted primarily from increases in WBI’s USPS MIP revenues and to DoD and commercial customer revenues and other projects performed for the USPS. Costs and operating expenses for our Supply Chain Management Group increased by approximately $19 million or 13% and operating income increased by approximately $5.8 million or 19% for 2015 as compared to the prior year. Costs and operating expenses and operating income increases resulted primarily from the increase in USPS MIP revenues. Operating income for this segment was decreased by approximately $527 thousand in 2015 and by approximately $3.1 million in 2014 due to adjustments to the accrued earn-out obligation for our WBI acquisition. The earn-out period for our WBI acquisition ended June 30, 2015, and the final earn-out payment for this obligation was made in September 2015.
Aviation Group Results
The results of operations for our Aviation Group since the acquisition date of January 28, 2015 are as follows (in thousands):
|
| | | | | | | | | | | | |
| Years ended December 31, |
| 2016 | | % | | 2015 | | % |
Revenues | $ | 133,466 |
| | 100.0 |
| | $ | 119,729 |
| | 100.0 |
Costs and operating expenses | 120,643 |
| | 90.4 |
| | 109,094 |
| | 91.1 |
Operating income | $ | 12,823 |
| | 9.6 |
| | $ | 10,635 |
| | 8.9 |
Our Aviation Group began operations upon the acquisition of our aviation businesses on January 28, 2015; therefore, the results for our Aviation Group include a full 12 months for 2016 and approximately 11 months for 2015. Accordingly, year over year comparisons for this group for 2016 should consider this variance.
Costs and operating expenses for this group include expense for amortization of intangible assets associated with the acquisition of our aviation businesses, allocated corporate costs, and valuation adjustments to the accrued earn-out obligation associated with the acquisition. Expense for amortization of intangible assets was approximately $6.6 million for 2016 and $6.1 million for 2015. Expense for allocated corporate costs was approximately $3.9 million for 2016 and $4.5 million for 2015. Valuation adjustments to the accrued earn-out obligation decreased costs and operating expenses approximately $1.3 million for 2016 and decreased costs and operating expenses approximately $101 thousand for 2015.
Federal Services Group Results
The results of operations for our Federal Group are (in thousands):
|
| | | | | | | | | | | | | | | | | | |
| Years ended December 31, |
| 2016 | | % | | 2015 | | % | | 2014 | | % |
Revenues | $ | 306,109 |
| | 100.0 |
| | $ | 166,973 |
| | 100.0 | | $ | 190,761 |
| | 100.0 |
Costs and operating expenses | 301,924 |
| | 98.6 |
| | 164,902 |
| | 98.8 | | 187,309 |
| | 98.2 |
Operating income | $ | 4,185 |
| | 1.4 |
| | $ | 2,071 |
| | 1.2 | | $ | 3,452 |
| | 1.8 |
Revenues for our Federal Services Group increased approximately $139 million or 83% and costs and operating expenses increased approximately $137 million or 83% for 2016, as compared to the prior year. Revenues for this group decreased approximately $24 million or 12% and costs and operating expenses decreased approximately $22 million or 12% for 2015, as compared to the prior year.
Significant items affecting changes in our revenues and costs and operating expenses for 2016 included an increase in revenue of approximately $93 million from our FMS Program services, an increase in revenue of approximately $40 million associated with the startup of our RRAD ERS Program, and an increase in revenue of approximately $15 million from the inclusion of a full year for our Ft. Benning Logistics Support Services Program as compared to a partial year in 2015.
Operating income and profit percentage increases for 2016 resulted primarily from the increase in revenues and a more favorable balance of our cost structure relative to revenue levels for this group that improved margins on our existing work. These increases were reduced by losses associated with the start of new contract work that was won in a more competitive bidding environment that requires us to price our services more aggressively to sustain and build our revenue levels
Significant items affecting changes in our revenues and costs and operating expenses for 2015 included a decrease in revenue of approximately $15.2 million associated with a reduction in our Army Reserve vehicle refurbishment work, a decrease in revenue of approximately $9.9 million associated with a reduction in our FMS Program services, a decrease in revenue of approximately $9.3 million associated with the completion of our U.S. Treasury Seized Assets Program in March 2014, and an increase in revenue of approximately $8.5 million associated with the start of our Ft. Benning Logistics Support Services Program.
Operating income and profit percentage decreases for 2015 resulted primarily from the decrease in revenues and to certain facility and infrastructure costs that could not be reduced as rapidly as the decline in the revenues on the programs that these costs supported.
Profit margins in this group can vary due to fluctuations in contract activity and the timing of contract award fees associated with our FMS Program. Award fee evaluations on our FMS Program occur three times per year and we recognize award fee revenue and income in the period we receive contractual notification of the award. We recognized award fee revenue and income in 2016 from three award fee notifications.
IT, Energy and Management Consulting Group Results
The results of operations for our IT, Energy and Management Consulting Group are (in thousands):
|
| | | | | | | | | | | | | | | | | | |
| Years ended December 31, |
| 2016 | | % | | 2015 | | % | | 2014 | | % |
Revenues | $ | 46,740 |
| | 100.0 |
| | $ | 50,508 |
| | 100.0 | | $ | 60,828 |
| | 100.0 |
Costs and operating expenses | 43,129 |
| | 92.3 |
| | 45,777 |
| | 90.6 | | 54,194 |
| | 89.1 |
Operating income | $ | 3,611 |
| | 7.7 |
| | $ | 4,731 |
| | 9.4 | | $ | 6,634 |
| | 10.9 |
Revenues for our IT, Energy and Management Consulting Group decreased approximately $4 million or 7% for 2016, as compared to the prior year. Costs and operating expenses decreased approximately $3 million or 6% for 2016, as compared to the prior year. The revenue and costs and operating expenses decreases resulted primarily from a decline in services ordered by clients and a loss of work performed on expiring contracts for which the follow-on work was often awarded to small businesses on set-aside contracts. While these circumstances have caused results to be lower on a year over year basis, revenue levels for 2016 have stabilized on a quarter to quarter basis. Operating income for this segment decreased approximately $1.1 million or 24% for 2016, as compared to the prior year. The decrease in operating income is primarily attributable to the decrease in revenue and lower profit margins resulting from more aggressive pricing of our services necessary to maintain competitiveness in current market conditions.
Revenues for our IT, Energy and Management Consulting Group decreased approximately $10 million or 17% for 2015, as compared to the prior year. Costs and operating expenses decreased approximately $8 million or 16% for 2015, as compared to the prior year. The revenue and costs and operating expenses decreases resulted primarily from a decline in services ordered by clients, contract expirations, and a loss of work performed by this group on expiring contracts for which the follow-on work was often awarded to small businesses on set-aside contracts. Operating income for this segment decreased approximately $1.9 million or 29% for 2015, as compared to the prior year. The decrease in operating income is primarily attributable to the decrease in revenue and lower profit margins resulting from cost balancing challenges associated with the lower revenue levels.
Financial Condition
There has been no material change in our financial condition in 2016. Changes to asset and liability accounts were due primarily to our earnings, our level of business activity, the timing of inventory purchases, contract delivery schedules, subcontractor and vendor payments required to perform our contract work, and the timing of associated billings to and collections from our customers. Our debt reduction in 2016 was limited by an increased capital commitment to support growth in our business and by a negotiated early termination of an earn-out obligation associated with our January 2015 Aviation Acquisition.
Liquidity and Capital Resources
Cash Flows
Cash and cash equivalents decreased by approximately $312 thousand during 2016.
Cash provided by operating activities increased by approximately $9.6 million in 2016 as compared to 2015. The change is attributable to an increase of approximately $10.2 million due to changes in the levels of operating assets and liabilities; an increase of approximately $1.9 million in cash provided by net income; and a decrease of approximately $2.5 million in depreciation and amortization and other non-cash operating activities.
Our inventories and accounts receivable represent a significant amount of our assets, and our accounts payable represent a significant amount of our operating liabilities. Cash used related to increases in inventory was approximately $27.2 million, cash used related to increases in accounts receivable was approximately $22.7 million, and cash provided by increases in account
payable was approximately $54.7 million for 2016. A significant portion of our inventory and accounts payable increases in 2016 resulted from opportunistic inventory purchases. A significant portion of our accounts receivable and accounts payable result from the use of subcontractors to perform work on our contracts and from the purchase of materials to fulfill our contract obligations. Accordingly, our levels of accounts receivable and accounts payable may fluctuate depending on the timing of services ordered and products sold, government funding delays, the timing of billings received from subcontractors and materials vendors, and the timing of payments received for services. Such timing differences have the potential to cause significant increases and decreases in our inventory, accounts receivable, and accounts payable in short time periods, and accordingly, can cause increases or decreases in our cash provided by operations.
Cash used in investing activities decreased approximately $199 million in 2016 as compared to 2015. Cash used in investing activities for 2015 included approximately $195 million for acquisitions.
Cash used in financing activities was approximately $41 million in 2016 as compared to cash provided by financing activities of approximately $168 million in 2015. This difference was primarily due to bank borrowing to finance our acquisitions in 2015. We used approximately $19 million in 2016 for payment of our final earn-out obligation for the 2015 Aviation Acquisition.
Cash provided by operating activities decreased by approximately $12.1 million in 2015 as compared to 2014. The change is attributable to a decrease of approximately $19.2 million due to changes in the levels of operating assets and liabilities; an increase of approximately $5.6 million in cash provided by net income; and an increase of approximately $1.5 million in depreciation and amortization and other non-cash operating activities.
Cash used in investing activities increased approximately $202 million in 2015 as compared to 2014. Cash used in investing activities for 2015 included approximately $195 million for acquisitions and approximately $11 million for purchases of property and equipment primarily related to the expansion of our WBI facilities.
Cash provided by financing activities was approximately $168 million in 2015 as compared to cash used in financing activities of approximately $46 million in 2014. This difference was primarily due to bank borrowing to finance our acquisitions in 2015. We used approximately $12 million for earn-out obligation payments.
We paid cash dividends totaling approximately $2.5 million or $0.23 per share during 2016. Pursuant to our bank loan agreement, our payment of cash dividends is subject to annual restrictions. We have paid cash dividends each year since 1973 and have increased our dividend each year since 2004.
Liquidity
Our internal sources of liquidity are primarily from operating activities, specifically from changes in our level of revenues and associated inventory, accounts receivable, and accounts payable, and from profitability. Significant increases or decreases in revenues and inventory, accounts receivable, and accounts payable can affect our liquidity. Our inventory and accounts payable levels can be affected by the timing of large opportunistic inventory purchases. Our accounts receivable and accounts payable levels can be affected by changes in the level of contract work we perform, by the timing of large materials purchases and subcontractor efforts used in our contracts, and by delays in the award of contractual coverage and funding and payments. Government funding delays can cause delays in our ability to invoice for revenues earned, presenting a potential negative impact on our days sales outstanding.
We also purchase property and equipment; invest in expansion, improvement, and maintenance of our operational and administrative facilities; and invest in the acquisition of other companies. In 2015, our acquisitions required a significant use of cash.
Our external financing consists of a loan agreement with a bank group that provides for a term loan, revolving loans, and letters of credit. The termination date of the loan agreement is January 2020. This agreement was implemented in January 2015 concurrent with the Aviation Acquisition. Our outstanding debt of approximately $214.6 million as of December 31, 2016 was net of unamortized deferred financing costs of approximately $1.7 million.
The term loan requires quarterly installment payments. Our scheduled term loan payments after December 31, 2016 are approximately $21.6 million in 2017, $28.1 million in 2018, $30 million in 2019, and $36.2 million in 2020. The amount of our term loan borrowings outstanding as of December 31, 2016 was $115.9 million.
The maximum amount of credit available to us under our loan agreement for revolving loans and letters of credit as of December 31, 2016 was $150 million. We may borrow and repay the revolving loan borrowings as our cash flows require or
permit. We pay an unused commitment fee and fees on letters of credit that are issued. We had approximately $100.4 million in revolving loan amounts outstanding and no of letters of credit outstanding as of December 31, 2016. The timing of certain payments made and collections received associated with our inventory, subcontractor, and materials requirements and other operating expenses can cause fluctuations in our outstanding revolving loan amounts. Delays in government funding of our work performed can also cause additional borrowing requirements.
Under the loan agreement we may elect to increase the maximum availability of the term loan facility, the revolving loan facility, or a combination of both facilities up to an aggregate additional amount of $75 million.
We pay interest on the term loan borrowings and revolving loan borrowings at LIBOR plus a base margin or at a base rate (typically the prime rate) plus a base margin. As of December 31, 2016, the LIBOR base margin was 2.25% and the base rate base margin was 1.25%. At inception of our loan agreement the LIBOR base margin was 2.25% and the base rate base margin was 1.00%. The base margins increase or decrease in increments as our Total Funded Debt/EBITDA Ratio increases or decreases.
Our loan agreement requires us to have interest rate hedges on a portion of the outstanding term loan for the first three years of the agreement. We executed compliant interest rate hedges in February 2015. After taking into account the impact of hedging instruments, as of December 31, 2016, interest rates on portions of our outstanding debt ranged from 2.96% to 4.75%, and the effective interest rate on our aggregate outstanding debt was 3.27%.
Our loan agreement contains collateral requirements to secure our loan agreement obligations, restrictive covenants, a limit on annual dividends, and other affirmative and negative covenants, conditions and limitations. Restrictive covenants include a maximum Total Funded Debt/EBITDA Ratio, which decreases over time, and a minimum Fixed Charge Coverage Ratio. We were in compliance with the financial covenants and other terms and conditions at December 31, 2016.
|
| | |
| Current Maximum Ratio | Actual Ratio |
Total Funded Debt/EBITDA Ratio | 3.00 to 1 | 2.67 to 1 |
|
| | |
| Minimum Ratio | Actual Ratio |
Fixed Charge Coverage Ratio | 1.20 to 1 | 1.54 to 1 |
We currently do not use public debt security financing.
Contractual Obligations
Our contractual obligations as of December 31, 2016 are (in thousands):
|
| | | | | | | | | | | | | | | | | | | | |
| | Payments Due by Period |
Contractual Obligations | | Total | | Less than 1 year | | 1-3 years | | 4-5 years | | After 5 years |
Bank loan debt | | $ | 216,308 |
| | $ | 21,563 |
| | $ | 58,125 |
| | $ | 136,620 |
| | $ | — |
|
Operating leases, net of non-cancelable sublease income | | 6,810 |
| | 3,504 |
| | 2,875 |
| | 426 |
| | 5 |
|
Corporate headquarters lease, net of non-cancelable sublease income | | 47,845 |
| | 3,377 |
| | 8,021 |
| | 9,284 |
| | 27,163 |
|
Purchase obligations | | 356 |
| | 303 |
| | 53 |
| | — |
| | — |
|
Total | | $ | 271,319 |
| | $ | 28,747 |
| | $ | 69,074 |
| | $ | 146,330 |
| | $ | 27,168 |
|
Estimated cash requirements for interest on our bank loan debt are approximately $6.8 million for 2017 and $5.1 million for 2018.
Operating lease commitments are primarily for leased facilities for office, shop, and warehouse space. Equipment and software leases are also included in these amounts.
We have a 15-year lease agreement related to our executive and administrative headquarters facility. Terms of our lease agreement have required us to capitalize the construction costs of the leased building and account for the lease upon occupancy in May 2012 under the finance method of lease accounting rules.
Purchase obligations consist primarily of contractual commitments associated with our information technology systems. The table excludes contractual commitments for materials or subcontractor work purchased to perform government contracts. Such commitments for materials and subcontractors are reimbursable when used on the contracts, and generally are also reimbursable if a contract is “terminated for convenience” by the government pursuant to federal contracting regulations.
Inflation and Pricing
Most of our contracts provide for estimates of future labor costs to be escalated for any option periods, while the non-labor costs in our contracts are normally considered reimbursable at cost. Our property and equipment consists principally of land, buildings and improvements, shop and warehouse equipment, computer systems equipment, and furniture and fixtures. We do not expect the overall impact of inflation on replacement costs of our property and equipment to be material to our future results of operations or financial condition.
ITEM 7A. Quantitative and Qualitative Disclosures About Market Risks
Interest Rates
Our bank loans provide available borrowing to us at variable interest rates. Accordingly, future interest rate changes could potentially put us at risk for a material adverse impact on future earnings and cash flows. To mitigate the risks associated with future interest rate movements we have employed interest rate hedges to fix the rate on a portion of our outstanding borrowings for various periods. The resulting fixed rates on this portion of our debt are higher than the variable rates and have increased our net effective rate, but have given us protection us against interest rate increases.
In February 2015, we entered into a LIBOR based interest rate swap on our term loan for a term of four years with a notional amount of $100 million. The swap amount on our term loan decreases in increments on an annual basis. As of December 31, 2016, the amount of the term loan swap was $75 million and with the term loan swap in place, we pay an effective interest rate of 1.25% plus our base margin. Also in February 2015, we entered into a LIBOR based interest rate swap on our revolving loan for a term of three years with a notional amount of $25 million. As of December 31, 2016, with the revolving loan swap in place, we pay an effective rate of 1.25% plus our base margin.
ITEM 8. Financial Statements and Supplementary Data
|
| |
Index To Financial Statements |
| |
| Page |
| |
| |
| |
| |
| |
| |
| |
| |
Report of Independent Registered Public Accounting Firm
The Board of Directors and Stockholders of VSE Corporation
We have audited the accompanying consolidated balance sheets of VSE Corporation and Subsidiaries as of December 31, 2016 and 2015, and the related consolidated statements of income, comprehensive income, stockholders' equity and cash flows for each of the three years in the period ended December 31, 2016. These financial statements are the responsibility of the Company's management. Our responsibility is to express an opinion on these financial statements based on our audits.
We conducted our audits in accordance with the standards of the Public Company Accounting Oversight Board (United States). Those standards require that we plan and perform the audit to obtain reasonable assurance about whether the financial statements are free of material misstatement. An audit includes examining, on a test basis, evidence supporting the amounts and disclosures in the financial statements. An audit also includes assessing the accounting principles used and significant estimates made by management, as well as evaluating the overall financial statement presentation. We believe that our audits provide a reasonable basis for our opinion.
In our opinion, the financial statements referred to above present fairly, in all material respects, the consolidated financial position of VSE Corporation and Subsidiaries at December 31, 2016 and 2015, and the consolidated results of their operations and their cash flows for each of the three years in the period ended December 31, 2016, in conformity with U.S. generally accepted accounting principles.
We also have audited, in accordance with the standards of the Public Company Accounting Oversight Board (United States), VSE Corporation and Subsidiaries' internal control over financial reporting as of December 31, 2016, based on criteria established in Internal Control-Integrated Framework issued by the Committee of Sponsoring Organizations of the Treadway Commission (2013 framework) and our report dated March 1, 2017 expressed an unqualified opinion thereon.
/s/ Ernst & Young LLP |
| |
McLean, Virginia | |
March 1, 2017 | |
VSE Corporation and Subsidiaries
Consolidated Balance Sheets
(in thousands, except share and per share amounts)
|
| | | | | | | |
| As of December 31, |
| 2016 | | 2015 |
Assets | | | |
Current assets: | | | |
Cash and cash equivalents | $ | 428 |
| | $ | 740 |
|
Receivables, net | 101,218 |
| | 78,471 |
|
Inventories, net | 136,340 |
| | 109,123 |
|
Other current assets | 20,477 |
| | 9,138 |
|
Total current assets | 258,463 |
| | 197,472 |
|
| | | |
Property and equipment, net | 62,061 |
| | 64,308 |
|
Intangible assets, net | 126,926 |
| | 143,043 |
|
Goodwill | 198,622 |
| | 198,545 |
|
Other assets | 15,767 |
| | 13,986 |
|
Total assets | $ | 661,839 |
| | $ | 617,354 |
|
| | | |
Liabilities and Stockholders' equity | |
| | |
|
Current liabilities: | |
| | |
|
Current portion of long-term debt | $ | 21,023 |
| | $ | 17,272 |
|
Accounts payable | 93,999 |
| | 40,084 |
|
Current portion of earn-out obligations | — |
| | 9,678 |
|
Accrued expenses and other current liabilities | 32,772 |
| | 29,067 |
|
Dividends payable | 648 |
| | 591 |
|
Total current liabilities | 148,442 |
| | 96,692 |
|
| | | |
Long-term debt, less current portion | 193,621 |
| | 215,243 |
|
Deferred compensation | 12,751 |
| | 11,169 |
|
Long-term lease obligations, less current portion | 21,959 |
| | 23,251 |
|
Earn-out obligations, less current portion | — |
| | 10,166 |
|
Deferred tax liabilities | 29,872 |
| | 31,524 |
|
Total liabilities | 406,645 |
| | 388,045 |
|
| | | |
Commitments and contingencies |
|
| |
|
|
| | | |
Stockholders' equity: | |
| | |
|
Common stock, par value $0.05 per share, authorized 15,000,000 shares; issued and outstanding 10,798,927 and 10,751,064 respectively | 540 |
| | 538 |
|
Additional paid-in capital | 22,876 |
| | 21,368 |
|
Retained earnings | 231,733 |
| | 207,478 |
|
Accumulated other comprehensive income (loss) | 45 |
| | (75 | ) |
Total stockholders' equity | 255,194 |
| | 229,309 |
|
Total liabilities and stockholders' equity | $ | 661,839 |
| | $ | 617,354 |
|
VSE Corporation and Subsidiaries
Consolidated Statements of Income
(in thousands, except share and per share amounts)
|
| | | | | | | | | | | |
| For the years ended December 31, |
| 2016 | | 2015 | | 2014 |
Revenues: | | | | | |
Products | $ | 341,776 |
| | $ | 318,141 |
| | $ | 172,986 |
|
Services | 350,014 |
| | 215,841 |
| | 251,085 |
|
Total revenues | 691,790 |
| | 533,982 |
| | 424,071 |
|
| | | | | |
Costs and operating expenses: | |
| | |
| | |
|
Products | 279,629 |
| | 258,009 |
| | 135,242 |
|
Services | 337,956 |
| | 206,570 |
| | 237,711 |
|
Selling, general and administrative expenses | 6,609 |
| | 3,288 |
| | 4,140 |
|
Amortization of intangible assets | 16,067 |
| | 15,576 |
| | 10,048 |
|
Total costs and operating expenses | 640,261 |
| | 483,443 |
| | 387,141 |
|
| | | | | |
Operating income | 51,529 |
| | 50,539 |
| | 36,930 |
|
| | | | | |
Interest expense, net | 9,855 |
| | 9,544 |
| | 3,983 |
|
| | | | | |
Income from continuing operations before income taxes | 41,674 |
| | 40,995 |
| | 32,947 |
|
| | | | | |
Provision for income taxes | 14,881 |
| | 16,077 |
| | 12,458 |
|
| | | | | |
Income from continuing operations | 26,793 |
| | 24,918 |
| | 20,489 |
|
| | | | | |
Loss from discontinued operations, net of tax | — |
| | — |
| | (1,124 | ) |
| | | | | |
Net income | $ | 26,793 |
| | $ | 24,918 |
| | $ | 19,365 |
|
| | | | | |
Basic earnings per share: | |
| | |
| | |
|
Income from continuing operations | $ | 2.48 |
| | $ | 2.32 |
| | $ | 1.91 |
|
Loss from discontinued operations | — |
| | — |
| | (0.10 | ) |
Net income | $ | 2.48 |
| | $ | 2.32 |
| | $ | 1.81 |
|
| | | | | |
Basic weighted average shares outstanding | 10,793,723 |
| | 10,747,226 |
| | 10,707,824 |
|
| | | | | |
Diluted earnings per share: | |
| | |
| | |
|
Income from continuing operations | $ | 2.47 |
| | $ | 2.31 |
| | $ | 1.91 |
|
Loss from discontinued operations | — |
| | — |
| | (0.10 | ) |
Net income | $ | 2.47 |
| | $ | 2.31 |
| | $ | 1.81 |
|
| | | | | |
Diluted weighted average shares outstanding | 10,828,152 |
| | 10,787,270 |
| | 10,742,400 |
|
VSE Corporation and Subsidiaries
Consolidated Statements of Comprehensive Income
(in thousands)
|
| | | | | | | | | | | |
| For the years ended December 31, |
| 2016 | | 2015 | | 2014 |
| | | | | |
Net income | $ | 26,793 |
| | $ | 24,918 |
| | $ | 19,365 |
|
Change in fair value of interest rate swap agreements | 120 |
| | (75 | ) | | 201 |
|
Other comprehensive income (loss), net of tax | 120 |
| | (75 | ) | | 201 |
|
Comprehensive income | $ | 26,913 |
| | $ | 24,843 |
| | $ | 19,566 |
|
VSE Corporation and Subsidiaries
Consolidated Statements of Stockholders' Equity
(in thousands except per share data)
|
| | | | | | | | | | | | | | | | | | | | | | |
| | | | | Additional Paid-In Capital | | Retained Earnings | | Accumulated Other Comprehensive Income (Loss) | | Total Stockholders' Equity |
| Common Stock | | | | |
| Shares | | Amount | | | | |
Balance at December 31, 2013 | 10,666 |
| | $ | 534 |
| | $ | 18,872 |
| | $ | 167,598 |
| | $ | (201 | ) | | $ | 186,803 |
|
Net income | — |
| | — |
| | — |
| | 19,365 |
| | — |
| | 19,365 |
|
Stock-based compensation | 50 |
| | 2 |
| | 1,208 |
| | — |
| | — |
| | 1,210 |
|
Change in fair value of interest rate swap agreements, net of tax | — |
| | — |
| | — |
| | — |
| | 201 |
| | 201 |
|
Dividends declared ($0.195 per share) | — |
| | — |
| | — |
| | (2,090 | ) | | — |
| | (2,090 | ) |
Balance at December 31, 2014 | 10,716 |
| | 536 |
| | 20,080 |
| | 184,873 |
| | — |
| | 205,489 |
|
Net income | — |
| | — |
| | — |
| | 24,918 |
| | — |
| | 24,918 |
|
Stock-based compensation | 35 |
| | 2 |
| | 1,288 |
| | — |
| | — |
| | 1,290 |
|
Change in fair value of interest rate swap agreements, net of tax | — |
| | — |
| | — |
| | — |
| | (75 | ) | | (75 | ) |
Dividends declared ($0.215 per share) | — |
| | — |
| | — |
| | (2,313 | ) | | — |
| | (2,313 | ) |
Balance at December 31, 2015 | 10,751 |
| | 538 |
| | 21,368 |
| | 207,478 |
| | (75 | ) | | 229,309 |
|
Net income | — |
| | — |
| | — |
| | 26,793 |
| | — |
| | 26,793 |
|
Stock-based compensation | 48 |
| | 2 |
| | 1,508 |
| | — |
| | — |
| | 1,510 |
|
Change in fair value of interest rate swap agreements, net of tax | — |
| | — |
| | — |
| | — |
| | 120 |
| | 120 |
|
Dividends declared ($0.235 per share) | — |
| | — |
| | — |
| | (2,538 | ) | | — |
| | (2,538 | ) |
Balance at December 31, 2016 | 10,799 |
| | $ | 540 |
| | $ | 22,876 |
| | $ | 231,733 |
| | $ | 45 |
| | $ | 255,194 |
|
VSE Corporation and Subsidiaries
Consolidated Statements of Cash Flows
(in thousands)
|
| | | | | | | | | | | |
| For the years ended December 31, |
| 2016 | | 2015 | | 2014 |
Cash flows from operating activities: | | | | | |
Net income | $ | 26,793 |
| | $ | 24,918 |
| | $ | 19,365 |
|
Adjustments to reconcile net income to net cash provided by operating activities: | |
| | |
| | |
|
Depreciation and amortization | 26,046 |
| | 25,541 |
| | 18,770 |
|
Deferred taxes | (1,146 | ) | | 84 |
| | 3,083 |
|
Stock-based compensation | 2,109 |
| | 2,081 |
| | 1,739 |
|
Earn-out obligation adjustment | (1,329 | ) | | 426 |
| | 3,059 |
|
Changes in operating assets and liabilities, net of impact of acquisitions: | |
| | |
| | |
|
Receivables, net | (22,747 | ) | | (8,139 | ) | | 18,996 |
|
Inventories | (27,217 | ) | | (10,381 | ) | | (10,048 | ) |
Other current assets and noncurrent assets | (13,020 | ) | | 6,031 |
| | (627 | ) |
Accounts payable and deferred compensation | 54,743 |
| | (362 | ) | | (1,224 | ) |
Accrued expenses and other current liabilities | 4,253 |
| | 1,919 |
| | (1,024 | ) |
Long-term lease obligations | (1,292 | ) | | (1,275 | ) | | (1,107 | ) |
Earn-out obligations | — |
| | (3,269 | ) | | — |
|
Other liabilities | — |
| | — |
| | (1,267 | ) |
| | | | | |
Net cash provided by operating activities | 47,193 |
| | 37,574 |
| | 49,715 |
|
| | | | | |
Cash flows from investing activities: | |
| | |
| | |
|
Purchases of property and equipment | (6,546 | ) | | (10,562 | ) | | (3,414 | ) |
Proceeds from the sale of property and equipment | 143 |
| | 507 |
| | — |
|
Cash paid for acquisitions, net of cash acquired | (63 | ) | | (195,135 | ) | | — |
|
| | | | | |
Net cash used in investing activities | (6,466 | ) | | (205,190 | ) | | (3,414 | ) |
| | | | | |
Cash flows from financing activities: | |
| | |
| | |
|
Borrowings on loan agreement | 321,630 |
| | 519,313 |
| | 295,513 |
|
Repayments on loan agreement | (340,046 | ) | | (333,222 | ) | | (336,601 | ) |
Earn-out obligation payments | (18,515 | ) | | (11,713 | ) | | (1,972 | ) |
Payment of debt financing costs | — |
| | (2,699 | ) | | — |
|
Payments on capital lease obligations | (1,128 | ) | | (986 | ) | | (850 | ) |
Payment of taxes for equity transactions | (499 | ) | | (342 | ) | | (314 | ) |
Dividends paid | (2,481 | ) | | (2,258 | ) | | (2,034 | ) |
| | | | | |
Net cash (used in) provided by financing activities | (41,039 | ) | | 168,093 |
| | (46,258 | ) |
| | | | | |
| | | | | |
Net (decrease) increase in cash and cash equivalents | (312 | ) | | 477 |
| | 43 |
|
Cash and cash equivalents at beginning of year | 740 |
| | 263 |
| | 220 |
|
Cash and cash equivalents at end of year | $ | 428 |
| | $ | 740 |
| | $ | 263 |
|
|
| | | | | | | | | | | |
Supplemental cash flow disclosures: | | | | | |
| | | | | |
Cash paid for: | | | | | |
Interest | $ | 8,230 |
| | $ | 6,621 |
| | $ | 2,135 |
|
Income taxes | $ | 18,886 |
| | $ | 15,949 |
| | $ | 9,934 |
|
VSE Corporation and Subsidiaries
Notes to Consolidated Financial Statements
December 31, 2016
(1) Nature of Business and Significant Accounting Policies
Nature of Business
The term "VSE," the "Company," "us," "we," or "our" means VSE and its subsidiaries and divisions unless the context indicates operations of only VSE as the parent company.
Our operations include supply chain management solutions and parts supply for vehicle fleets; maintenance, repair, and overhaul ("MRO") services and parts supply for aviation clients; vehicle and equipment maintenance and refurbishment; logistics; engineering; energy and environmental services; IT and health care IT solutions; and consulting services. We provide logistics services for legacy systems and equipment and professional and technical services to the United States Government (the "government"), including the United States Postal Service ("USPS"), the United States Department of Defense ("DoD"), federal civilian agencies, commercial customers, and to other customers.
Principles of Consolidation
The consolidated financial statements consist of the operations of our parent company, our wholly owned subsidiaries, Energetics Incorporated ("Energetics"), Akimeka, LLC ("Akimeka"), Wheeler Bros., Inc. ("WBI") and VSE Aviation, Inc., and our unincorporated divisions. All intercompany transactions have been eliminated in consolidation. These consolidated financial statements also account for the classification of the Infrastructure Group as discontinued operations of our subsidiary Integrated Concepts and Research Corporation ("ICRC") and therefore any financial impact of such group has been presented as discontinued operations in the 2014 reporting period.
Use of Estimates in the Preparation of Financial Statements
The preparation of financial statements in conformity with accounting principles generally accepted in the United States requires us to make estimates and assumptions that affect the reported amounts of assets and liabilities and disclosure of contingent assets and liabilities at the date of the financial statements and the reported amounts of revenues and expenses during the reporting period. Actual results could differ from those estimates. Significant estimates affecting the financial statements include accruals for contract disallowance reserves, recoverability of goodwill and intangible assets and earn-out obligations.
Stock Split Effected in Form of Stock Dividend
In May 2016, our Board of Directors approved a two-for-one stock split effected in the form of a stock dividend ("Stock Split"). The Stock Split had a record date of July 20, 2016 and the resulting stock distribution occurred on August 3, 2016. All references made to share or per share amounts in the accompanying consolidated financial statements and applicable disclosures have been retroactively adjusted to reflect the Stock Split.
Reclassifications
Effective January 1, 2016, we elected to present amortization of purchased intangible assets as a separate line item and change the line item "Contract costs" to "Costs and operating expenses" on our consolidated statements of income. For consistency, these amortization expenses have been reclassified in the consolidated statements of income for the years ended December 31, 2015 and 2014 to conform to the current period presentation. As a result, amortization expenses for the year ended December 31, 2015 previously reflected as contract costs of $13.9 million in "Products" and $1.7 million in "Services" were reclassified to the "Amortization of intangible assets" line item within cost and operating expenses. Amortization expenses for the year ended December 31, 2014 previously reflected as contract costs of $7.7 million in "Products" and $2.3 million in "Services" were reclassified to the "Amortization of intangible assets" line item within cost and operating expenses.
We adopted Accounting Standards Update ("ASU") 2015-17, Balance Sheet Classification of Deferred Taxes, and ASU 2015-03, Simplifying the Presentation of Debt Issuance Costs, on January 1, 2016 and prior period amounts have been reclassified to conform to the current period presentation. See Recently Issued Accounting Pronouncements section in Note 1 for additional information.
These reclassifications have no effect on our reported financial condition, results of operations, and cash flows.
Stock-Based Compensation
We account for share-based awards in accordance with the applicable accounting rules that require the measurement and recognition of compensation expense for all share-based payment awards based on estimated fair values. The compensation expense, included in costs and operating expenses, is amortized over the requisite service period using the accelerated attribution method.
Earnings Per Share
Basic earnings per share ("EPS") is computed by dividing net income by the weighted average number of shares of common stock outstanding during each period. Shares issued during the period are weighted for the portion of the period that they were outstanding. Our calculation of diluted earnings per common share includes the dilutive effects for the assumed vesting of restricted stock awards.
|
| | | | | | | | |
| Years Ended December 31, |
| 2016 | | 2015 | | 2014 |
Basic weighted average common shares outstanding | 10,793,723 |
| | 10,747,226 |
| | 10,707,824 |
|
Effect of dilutive shares | 34,429 |
| | 40,044 |
| | 34,576 |
|
Diluted weighted average common shares outstanding | 10,828,152 |
| | 10,787,270 |
| | 10,742,400 |
|
Cash and Cash Equivalents
We consider all highly liquid investments with an original maturity of three months or less to be cash equivalents. Due to the short maturity of these instruments, the carrying values on our consolidated balance sheets approximate fair value.
Property and Equipment
Property and equipment are recorded at cost. Depreciation of computer equipment, furniture, other equipment is provided principally by the straight-line method over periods of 3 to 15 years. Depreciation of buildings and land improvements is provided by the straight-line method over periods of approximately 15 to 20 years. Amortization of leasehold improvements is provided by the straight-line method over the lesser of their useful life or the remaining term of the lease.
Concentration of Credit Risk/Fair Value of Financial Instruments
Financial instruments that potentially subject us to concentration of credit risk consist primarily of cash, cash equivalents and trade receivables. Contracts with the government, either as a prime or subcontractor, accounted for approximately 80%, 77%, and 99% of revenues for the years ended December 31, 2016, 2015 and 2014, respectively. We believe that concentrations of credit risk with respect to trade receivables are limited as they are primarily government receivables. We believe that the fair market value of all financial instruments, including debt, approximate book value.
Revenues
Revenue is recognized when persuasive evidence of an arrangement exists, delivery has occurred or services have been rendered, the fee is fixed or determinable, and collectability is probable.
Substantially all of our Supply Chain Management Group revenues result from the sale of vehicle parts to clients. We recognize revenue from the sale of vehicle parts when the customer takes ownership of the parts.
Our Aviation Group revenues are recognized upon the shipment or delivery of products to customers based on when title or risk of loss transfers to the customer. Sales returns and allowances are not significant.
Substantially all of our Federal Services and IT, Energy and Management Consulting work is performed for our customers on a contract basis. The three primary types of contracts used are cost-type, fixed-price and time and materials. Revenues result from work performed on these contracts by our employees and our subcontractors and from costs for materials and other work related costs allowed under our contracts.
Revenues on cost-type contracts are recorded as contract allowable costs are incurred and fees are earned. Our FMS Program contract is a cost plus award fee contract. This contract has terms that specify award fee payments that are determined by performance and level of contract activity. Award fees are made during the year through a contract modification authorizing the award fee that is issued subsequent to the period in which the work is performed. We recognize award fee income on the FMS Program contract when the fees are fixed or determinable. Due to such timing, and to fluctuations in the level of revenues, profits as a percentage of revenues on this contract will fluctuate from period to period.
Revenue recognition methods on fixed-price contracts will vary depending on the nature of the work and the contract terms. Revenues on fixed-price service contracts are recorded as work is performed, typically ratably over the service period. Revenues on fixed-price contracts that require delivery of specific items are recorded based on a price per unit as units are delivered.
Revenues for time and materials contracts are recorded on the basis of contract allowable labor hours worked multiplied by the contract defined billing rates, plus the direct costs and indirect cost burdens associated with materials and subcontract work used in performance on the contract. Generally, profits on time and materials contracts result from the difference between the cost of services performed and the contract defined billing rates for these services.
Revenue related to work performed on government contracts at risk, which is work performed at the customer's request prior to the government formalizing funding, is not recognized until it can be reliably estimated and its realization is probable.
A substantial portion of contract and administrative costs are subject to audit by the Defense Contract Audit Agency. Our indirect cost rates have been audited and approved for 2011 and prior years with no material adjustments to our results of operations or financial position. While we maintain reserves to cover the risk of potential future audit adjustments based primarily on the results of prior audits, we do not believe any future audits will have a material adverse effect on our results of operations or financial position.
Receivables and Allowance for Doubtful Accounts
Receivables are recorded at amounts earned less an allowance for doubtful accounts. We review our receivables regularly to determine if there are any potentially uncollectible accounts. The majority of our receivables are from government agencies, where there is minimal credit risk. We record allowances for bad debt as a reduction to receivables and an increase to bad debt expense. We assess the adequacy of these reserves by considering general factors, such as the length of time individual receivables are past due and historical collection experience.
Inventories
Inventories for our Supply Chain Group are stated at the lower of cost or market using the first-in, first-out ("FIFO") method. Included in inventory are related purchasing, storage, and handling costs. Our inventory primarily consists of vehicle replacement parts.
Inventories for our Aviation Group are stated at lower of cost or market. Inventories for our Aviation Group primarily consist of general aviation jet aircraft engines and engine accessories and parts. The cost for purchased engines and parts is determined by the specific identification method. Included in inventory are related purchasing, overhaul labor, storage, and handling costs. We also purchase aircraft engines for disassembly into individual parts and components.
Deferred Compensation Plans
We have a deferred compensation plan, the VSE Corporation Deferred Supplemental Compensation Plan ("DSC Plan"), to provide incentive and reward for certain management employees based on overall corporate performance. We maintain the underlying assets of the DSC Plan in a Rabbi Trust and changes in asset values are included in costs and operating expenses on the accompanying consolidated statements of income. We invest the assets held by the Rabbi Trust in both corporate owned life insurance ("COLI") products and in mutual funds. The COLI investments are recorded at cash surrender value and the mutual fund investments are recorded at fair value. The DSC Plan assets are included in other assets and the obligation to the participants is included in deferred compensation on the accompanying consolidated balance sheets.
Deferred compensation plan expense recorded as costs and operating expenses in the accompanying consolidated statements of income for the years ended December 31, 2016, 2015, and 2014 was approximately $1.7 million, $1.9 million, and $1.3 million, respectively.
Impairment of Long-Lived Assets
Long-lived assets include intangible assets and property and equipment to be held and used. We review the carrying values of long-lived assets other than goodwill for impairment if events or changes in the facts and circumstances indicate that their carrying values may not be recoverable. We assess impairment by comparing the estimated undiscounted future cash flows of the related asset to its carrying value. If an asset is determined to be impaired, we recognize an impairment charge in the current period for the difference between the fair value of the asset and its carrying value.
No impairment charges related to long-lived assets, other than goodwill, were recorded in the years ended December 31, 2016, December 31, 2015 and December 31, 2014.
Income Taxes
Income taxes are accounted for under the asset and liability method. Under the asset and liability method, deferred tax assets and liabilities are recognized for the estimated future tax consequences attributable to differences between the financial statement carrying amounts of existing assets and liabilities and their respective tax basis. This method also requires the recognition of future tax benefits, such as net operating loss carryforwards, to the extent that realization of such benefits is more likely than not. Deferred tax assets and liabilities are measured using enacted tax rates expected to apply to taxable income in the years in which those temporary differences are expected to be recovered or settled. The effect on deferred tax assets and liabilities of a change in tax rates is recognized in income in the period that includes the enactment date.
The carrying value of net deferred tax assets is based on assumptions regarding our ability to generate sufficient future taxable income to utilize these deferred tax assets.
Goodwill
We test goodwill for impairment annually in the fourth quarter and whenever events or changes in circumstances indicate the carrying value of goodwill may not be recoverable. The goodwill impairment test involves a two-step process. In the first step, we compare the fair value of each reporting unit to its carrying value. If the fair value of the reporting unit exceeds its carrying value, goodwill is considered not impaired and no further testing is required. If the fair value of the reporting unit is less than the carrying value, we must perform the second step of the impairment test to measure the amount of the goodwill impairment loss. In the second step, the reporting unit's fair value is allocated to all of the assets and liabilities of the reporting unit, including any unrecognized intangible assets, in a hypothetical analysis that calculates the implied fair value of goodwill in the same manner as if the reporting unit was being acquired in a business combination. If the implied fair value of the reporting unit's goodwill is less than the carrying value, the difference is recorded as an impairment loss. Based on our annual goodwill impairment analysis we performed in the fourth quarter of 2016, the fair value of our reporting units exceeded their carrying values.
Intangible Assets
Intangible assets consist of the value of contract-related intangible assets, trade names and acquired technologies acquired in acquisitions. We amortize on a straight-line basis intangible assets acquired as part of acquisitions over their estimated useful lives unless their useful lives are determined to be indefinite. The amounts we record related to acquired intangibles are determined by us considering the results of independent valuations. Our contract-related intangibles are amortized over their estimated useful lives of approximately seven to 16 years with a weighted-average life of approximately 12.6 years as of December 31, 2016. We have four trade names that are amortized over an estimated useful life of approximately nine years. We have an acquired technologies intangible asset that is amortized over an estimated useful life of 11 years. The weighted-average life for all amortizable intangible assets is approximately 12.2 years as of December 31, 2016.
Subsequent Events
In January 2017, our insurers and the Municipality of Anchorage, Alaska fully settled the Anchorage Lawsuit and Coverage Lawsuit. The United States District Court approved these lawsuit settlements in February 2017 and dismissed both lawsuits.
In January 2017, the Maritime Administration agreed to a settlement for payment of contract closeout costs that were incurred related to services performed for two Port of Anchorage Intermodal Expansion Contracts.
In February 2017, VSE and Heritage entered into an agreement in respect of the Heritage Litigation pursuant to which VSE paid approximately $3.3 million to Heritage in full settlement of the lawsuit.
For further discussion of the matters above, see Note 11, "Commitments and Contingencies."
Recently Issued Accounting Pronouncements
In November 2015, the Financial Accounting Standards Board ("FASB") issued Accounting Standards Update ("ASU") No. 2015-17, Balance Sheet Classification of Deferred Taxes, which amends the current requirement for organizations to present deferred tax assets and liabilities as current and noncurrent in a classified balance sheet. Organizations will now be required to classify all deferred tax assets and liabilities as noncurrent. The ASU will become effective for us in January 2017; however, early adoption is permitted. The ASU can be applied either prospectively to all deferred tax liabilities and assets or retrospectively to all periods presented. We adopted ASU 2015-17 on January 1, 2016 and retrospectively applied this amended accounting guidance to our deferred tax liabilities and assets for all periods presented. The impact of this change in accounting principle on balances previously reported as of December 31, 2015 was a reclassification of our net current deferred tax assets of approximately $3.6 million to net long-term deferred tax liabilities. The adoption of ASU 2015-17 did not impact our consolidated financial position, results of operations or cash flows.
In April 2015, the FASB issued ASU No. 2015-03, Simplifying the Presentation of Debt Issuance Costs. Under the new standard, debt issuance costs related to a recognized debt liability are required to be presented in the balance sheet as a direct deduction from the carrying amount of that debt liability, consistent with debt discounts. The guidance in ASU 2015-03 is effective for the fiscal year, and interim periods within that fiscal year, beginning after December 15, 2015. We adopted the provisions of ASU 2015-03 on January 1, 2016 and prior period amounts have been reclassified to conform to the current period presentation. As of December 31, 2015, approximately $285 thousand of debt issuance cost was reclassified in the consolidated balance sheet from other current assets to current portion of long-term debt and approximately $882 thousand was reclassified from other assets to long-term debt, less current portion. The adoption of ASU 2015-03 did not impact our consolidated financial position, results of operations or cash flows.
In July 2015, the FASB issued ASU No. 2015-11, Simplifying the Measurement of Inventory, which clarifies that, for inventories measured at the lower of cost and net realizable value, net realizable value should be determined based on the estimated selling prices in the ordinary course of business less reasonably predictable costs of completion, disposal, and transportation. The new standard is effective for annual and interim periods beginning after December 15, 2016, and should be applied prospectively with early adoption permitted. We will adopt the new standard in the first quarter of 2017, and the adoption of this standard will not have a material impact on the consolidated financial statements.
In June 2016, the FASB issued ASU No. 2016-13, Measurement of Credit Losses on Financial Instruments, which changes the methodology for measuring credit losses on financial instruments and the timing of when such losses are recorded. The new standard is effective for reporting periods beginning after December 15, 2019 with early adoption permitted for reporting periods beginning after December 15, 2018. We currently are assessing the impact that this standard will have on our consolidated financial statements.
In March 2016, the FASB issued ASU No. 2016-09, Improvements to Employee Share-Based Payment Accounting, which is intended to simplify the accounting for share-based payment transactions, including the income tax consequences, classification of awards as either equity or liabilities and classification on the statement of cash flows. The new standard is effective for reporting periods beginning after December 15, 2016 with early adoption permitted. We currently are assessing the impact that this standard will have on our consolidated financial statements.
In February 2016, the FASB issued ASU No. 2016-02, Leases (Topic 842), to increase transparency and comparability among organizations by recognizing lease assets and lease liabilities on the balance sheet and disclosing key information about leasing arrangements. The new standard is effective for reporting periods beginning after December 15, 2018 with early adoption permitted. We currently are assessing the impact that this standard will have on our consolidated financial statements.
In January 2017, the FASB issued ASU No. 2017-04, Simplifying the Test for Goodwill Impairment, which eliminates the requirement to determine the fair value of individual assets and liabilities of a reporting unit to measure goodwill impairment. Under the amendments in the new ASU, goodwill impairment testing will be performed by comparing the fair value of the reporting unit with its carrying amount and recognizing an impairment charge for the amount by which the carrying amount exceeds the reporting unit’s fair value. The new standard is effective for annual and interim goodwill impairment tests in fiscal years beginning after December 15, 2019, and should be applied on a prospective basis with early adoption permitted. We currently are assessing the impact that this standard will have on our consolidated financial statements.
In May 2014, the FASB issued ASU No. 2014-09, Revenue from Contracts with Customers, which outlines a single comprehensive model for entities to use in accounting for revenue arising from contracts with customers and supersedes most current revenue recognition guidance, including industry-specific guidance. The ASU is based on the principle that an entity should recognize revenue to depict the transfer of goods or services to customers in an amount that reflects the consideration to which the entity expects to be entitled in exchange for the goods or services. The standard is required to be applied either retrospectively to each prior reporting period presented or retrospectively with the cumulative effect of initially applying it recognized at the date of initial application. The ASU also requires additional disclosure about the nature, amount, timing and uncertainty of revenue and cash flows arising from customer contracts, including significant judgments and changes in judgments and assets recognized from costs incurred to fulfill a contract. The new standard, as amended, is effective for interim and annual periods beginning on or after December 15, 2017 with early adoption permitted. We are still in the process of evaluating the effect of adoption on our consolidated financial statements and are currently assessing our contracts with our customers. We have not yet concluded on our transition method upon adoption. We plan to adopt the standard when it becomes effective for us beginning January 1, 2018.
(2) Receivables, net
Total receivables, net of allowance for doubtful accounts of approximately $30 thousand and $100 thousand as of December 31, 2016 and 2015, respectively, were as follows (in thousands):
|
| | | | | | | |
| 2016 | | 2015 |
Billed | $ | 55,669 |
| | $ | 43,503 |
|
Unbilled | 45,549 |
| | 34,968 |
|
Total receivables | $ | 101,218 |
| | $ | 78,471 |
|
The unbilled balance includes certain costs for work performed at risk but which we believe will be funded by the government totaling approximately $2.1 million and $1.5 million as of December 31, 2016 and 2015, respectively. We expect to invoice substantially all unbilled receivables during 2017.
(3) Other Current Assets and Other Assets
At December 31, 2016 and 2015, other current assets primarily consisted of vendor advances, prepaid rents and deposits, prepaid income taxes, software licenses, prepaid maintenance agreements and deferred contract costs. At December 31, 2016 and 2015, other assets primarily consisted of deferred compensation plan assets.
(4) Property and Equipment
Property and equipment consisted of the following as of December 31, 2016 and 2015 (in thousands):
|
| | | | | | | |
| 2016 | | 2015 |
Buildings and building improvements | $ | 52,972 |
| | $ | 51,148 |
|
Computer equipment | 29,463 |
| | 27,504 |
|
Furniture, fixtures, equipment and other | 29,455 |
| | 27,384 |
|
Leasehold improvements | 545 |
| | 2,036 |
|
Land and land improvements | 4,214 |
| | 4,214 |
|
| 116,649 |
| | 112,286 |
|
Less accumulated depreciation and amortization | (54,588 | ) | | (47,978 | ) |
Total property and equipment, net | $ | 62,061 |
| | $ | 64,308 |
|
Depreciation and amortization expense for property and equipment for the years ended December 31, 2016, 2015 and 2014 was approximately $9.4 million, $9.1 million and $7.9 million, respectively.
(5) Acquisitions
Ultra Seating
On December 31, 2015, we acquired Ultra Seating Company ("Ultra Seating") for approximately $3.6 million, which represents cash consideration of $3.8 million adjusted for the settlement of pre-existing liabilities and a final working capital adjustment. Ultra Seating provides specialized seating for commercial trucks and buses. Ultra Seating is included in our Supply Chain Management Group.
We have completed our purchase price allocation and recognized fair values of assets acquired (including intangible assets), liabilities assumed and the amortization period for the intangible assets. We recorded approximately $2.0 million of goodwill and approximately $1.5 million of intangible assets, primarily related to customer relationships and a trade name. During 2016, we recorded immaterial purchase accounting adjustments based on changes to management’s estimates and assumptions in regards to acquired intangible assets and assumed liabilities.
The pro forma effects, assuming our acquisition of Ultra Seating had occurred as of January 1, 2015, were not material to our total revenues, net income or earnings per share for the year ended December 31, 2015.
VSE Aviation
On January 28, 2015, we acquired four related businesses that perform maintenance, repair and overhaul ("MRO") services and parts supply for general aviation jet aircraft engines and engine accessories. The acquired businesses include Air Parts & Supply Co., Kansas Aviation of Independence, L.L.C., Prime Turbines LLC (including U.S. and German-based operations), and CT Aerospace LLC (collectively, "the Aviation Acquisition"). These four businesses are operating as a combined group managed by our subsidiary VSE Aviation, Inc.
The initial purchase consideration paid at closing for the Aviation Acquisition was approximately $189 million, which included an estimated net working capital adjustment of approximately $5 million. Additional cash consideration of $2.4 million was paid to the sellers during the third quarter of 2015 based on the final working capital adjustment.
We were required under a post-closing-earn-out obligation contained in the Aviation Acquisition agreement to make additional purchase price payments of up to $40 million if the acquired businesses satisfied certain financial targets during the first two post-closing years. Consideration of $5 million was paid to the sellers in September 2015 because certain of the acquired businesses surpassed agreed upon financial targets during a 12- consecutive month period in 2014 and 2015. In July 2016, VSE and the sellers of the four aviation businesses agreed upon an early termination of the earn-out obligation and a final payment amount. VSE paid the sellers approximately $8.0 million as an earn-out payment in May 2016 and the final earn-out payment of approximately $10.5 million in July 2016.
We incurred approximately $528 thousand of acquisition-related expenses during the year ended December 31, 2015 which are included in selling, general and administrative expenses.
The following VSE unaudited consolidated pro forma results are prepared as if the Aviation Acquisition had occurred on January 1, 2014. This information is for comparative purposes only and does not necessarily reflect the results that would have occurred or may occur in the future. The following unaudited consolidated pro forma results of operations are as following (in thousands except per share amounts):
|
| | | | | | | |
| Years Ended December 31, |
| 2015 | | 2014 |
Revenue | $ | 541,387 |
| | $ | 536,867 |
|
Income from continuing operations | $ | 25,267 |
| | $ | 26,040 |
|
Basic earnings per share | $ | 2.35 |
| | $ | 2.43 |
|
Diluted earnings per share | $ | 2.34 |
| | $ | 2.42 |
|
(6) Goodwill and Intangible Assets
Changes in goodwill for the years ended December 31, 2016 and 2015 are as follows (in thousands):
|
| | | | | | | | | | | | | | | |
| Supply Chain Management | | IT, Energy and Management Consulting | | Aviation | | Total |
Balance as of December 31, 2014 | $ | 61,169 |
| | $ | 30,883 |
| | $ | — |
| | $ | 92,052 |
|
Increase from acquisitions | 1,944 |
| | — |
| | 104,549 |
| | 106,493 |
|
Balance as of December 31, 2015 | $ | 63,113 |
| | $ | 30,883 |
| | $ | 104,549 |
| | $ | 198,545 |
|
Increase from acquisitions | 77 |
| | — |
| | — |
| | 77 |
|
Balance as of December 31, 2016 | $ | 63,190 |
| | $ | 30,883 |
| | $ | 104,549 |
| | $ | 198,622 |
|
The results of our annual goodwill impairment testing in the fourth quarter of 2016 indicated that the fair value of our reporting units exceeded their carrying values.
Intangible assets consist of the value of contract-related assets, technologies and trade names. Amortization expense for the years ended December 31, 2016, 2015 and 2014 was approximately $16.1 million, $15.6 million and $10.0 million, respectively.
Intangible assets were composed of the following (in thousands):
|
| | | | | | | | | | | | | | | |
| Cost | | Accumulated Amortization | | Accumulated Impairment Loss | | Net Intangible Assets |
December 31, 2016 | | | | | | | |
Contract and customer-related | $ | 173,094 |
| | $ | (59,799 | ) | | $ | (1,025 | ) | | $ | 112,270 |
|
Acquired technologies | 12,400 |
| | (6,278 | ) | | — |
| | 6,122 |
|
Trade names | 16,670 |
| | (8,136 | ) | | — |
| | 8,534 |
|
Total | $ | 202,164 |
| | $ | (74,213 | ) | | $ | (1,025 | ) | | $ | 126,926 |
|
| | | | | | | |
December 31, 2015 | |
| | |
| | |
| | |
|
Contract and customer-related | $ | 173,084 |
| | $ | (46,611 | ) | | $ | (1,025 | ) | | $ | 125,448 |
|
Acquired technologies | 12,400 |
| | (5,151 | ) | | — |
| | 7,249 |
|
Trade names | 16,730 |
| | (6,384 | ) | | — |
| | 10,346 |
|
Total | $ | 202,214 |
| | $ | (58,146 | ) | | $ | (1,025 | ) | | $ | 143,043 |
|
Future expected amortization of intangible assets is as follows for the years ending December 31, (in thousands):
|
| | | |
| Amortization |
2017 | $ | 16,017 |
|
2018 | 16,017 |
|
2019 | 15,953 |
|
2020 | 15,362 |
|
2021 | 14,998 |
|
Thereafter | 48,579 |
|
Total | $ | 126,926 |
|
(7) Debt
We have a loan agreement with a group of banks that was amended in January 2015 to fund our Aviation Acquisition, provide working capital for our continuing operations, and retire our existing debt. The loan agreement, which expires in January 2020, is comprised of a term loan facility and a revolving loan facility. The revolving loan facility provides for revolving loans and letters of credit. Financing costs associated with the inception of the amended loan agreement of approximately $2.7 million were capitalized and are being amortized over the five-year life of the loan.
Our required term loan payments after December 31, 2016 are approximately $21.6 million in 2017, $28.1 million in 2018, $30.0 million in 2019, and $36.2 million in 2020. The amount of our term loan borrowings outstanding as of December 31, 2016 was $115.9 million.
The maximum amount of credit available to us under the loan agreement for revolving loans and letters of credit as of December 31, 2016 was $150 million. We may borrow and repay the revolving loan borrowings as our cash flows require or permit. We pay an unused commitment fee and fees on letters of credit that are issued. We had approximately $100.4 million in revolving loan amounts outstanding and no letters of credit outstanding as of December 31, 2016. We had approximately $101 million in revolving loan amounts outstanding and no of letters of credit outstanding as of December 31, 2015.
Under the loan agreement we may elect to increase the maximum availability of the term loan facility, the revolving loan facility, or a combination of both facilities up to an aggregate additional amount of $75 million.
Total bank loan borrowed funds outstanding including term loan borrowings and revolving loan borrowings were approximately $216.3 million and $234.7 million as of December 31, 2016 and 2015, respectively. These amounts exclude unamortized deferred financing costs of approximately $1.7 million and $2.2 million as of December 31, 2016 and 2015, respectively. The fair value of outstanding debt under our bank loan facilities as of December 31, 2016 approximates its carrying value using Level 2 inputs based on market data on companies with a corporate rating similar to ours that have recently priced credit facilities.
We pay interest on the term loan borrowings and revolving loan borrowings at LIBOR plus a base margin or at a base rate (typically the prime rate) plus a base margin. As of December 31, 2016, the LIBOR base margin was 2.25% and the base rate base margin was 1.00%. The base margins increase or decrease in increments as our Total Funded Debt/EBITDA Ratio increases or decreases.
The loan agreement requires us to have interest rate hedges on a portion of the outstanding term loan for the first three years of the agreement. We executed interest rate hedges in February 2015 that complied with these terms. The amount of swapped debt outstanding as of December 31, 2016 was $100 million.
After taking into account the impact of hedging instruments, as of December 31, 2016, interest rates on portions of our outstanding debt ranged from 2.96% to 4.75%, and the effective interest rate on our aggregate outstanding debt was 3.27%.
Interest expense incurred on bank loan borrowings and interest rate hedges was approximately $7.8 million and $7.3 million during the years ended December 31, 2016 and 2015, respectively.
The loan agreement contains collateral requirements to secure our loan agreement obligations, restrictive covenants, a limit on annual dividends, and other affirmative and negative covenants, conditions and limitations. Restrictive covenants include a maximum Total Funded Debt/EBITDA Ratio, which decreases over time, and a minimum Fixed Charge Coverage Ratio. We were in compliance with the financial covenants and other terms and conditions as of December 31, 2016.
(8) Accrued Expenses and Other Current Liabilities
Accrued expenses and other current liabilities consist primarily of accrued compensation and benefits of approximately $20.7 million and $19.2 million as of December 31, 2016 and 2015, respectively. The accrued compensation and benefits amounts include bonus, salaries and related payroll taxes, vacation and deferred compensation.
(9) Stock-Based Compensation Plans
In 2006, our stockholders approved the VSE Corporation 2006 Restricted Stock Plan for its directors, officers and other employees (the "2006 Plan"). In May 2014, the stockholders approved amendments to the 2006 Plan extending its term until May 6, 2021 and authorizing an additional 500,000 shares of our common stock for issuance under the 2006 Plan. Under the 2006 Plan, we are authorized to issue up to 1,000,000 shares of our common stock and, as of December 31, 2016, 476,140 shares remained available for issuance under the 2006 Plan. The Compensation Committee is responsible for the administration of the 2006 Plan, and determines each recipient of an award under the 2006 Plan, the number of restricted shares of common stock subject to such award and the period of continued employment required for the vesting of such award. These terms are included in award agreements between VSE and the recipients of the award.
During 2016 and 2015, non-employee directors were awarded 17,600 and 18,000 shares of restricted stock, respectively, under the 2006 Plan. The weighted average grant-date fair value of these restricted stock grants was $30.89 per share and $34.29 per share for the shares awarded in 2016 and 2015, respectively. The shares issued vested immediately and, without the Compensation Committee's approval, cannot be sold, transferred, pledged or assigned before the second anniversary of the grant date. Compensation expense related to these grants was approximately $544 thousand and $617 thousand during 2016 and 2015, respectively.
In January of every year since 2007, we have notified certain employees that they are eligible to receive awards of VSE stock under our 2006 Plan, based on our financial performance for the respective fiscal years. These restricted stock awards are expensed and a corresponding liability is recorded on an accelerated basis over the vesting period of approximately three years. Upon issuance of shares on each vesting date, the liability is reduced and additional paid-in capital is increased. The date of award determination is expected to be in March 2017 for the 2016 awards. The date of award determination for the 2015 awards and the 2014 awards was March 1, 2016 and March 2, 2015, respectively. On each vesting date, 100% of the vested award is paid in our shares. The number of shares issued is based on the fair market value of our common stock on the vesting date. The earned amount is expensed on an accelerated basis over the vesting period of approximately three years. On March 1, 2016, the employees eligible for the 2015 awards, 2014 awards and 2013 awards received a total of 30,020 shares of common stock. The grant-date fair value of these awards was $31.88 per share.
The total stock-based compensation expense related to restricted stock awards for the years ended December 31, are as follows (in thousands):
|
| | | | | | | | | | | |
| 2016 | | 2015 | | 2014 |
Employees | $ | 1,555 |
| | $ | 1,423 |
| | $ | 1,104 |
|
Non-employee Directors | 544 |
| | 617 |
| | 510 |
|
Total | $ | 2,099 |
| | $ | 2,040 |
| | $ | 1,614 |
|
Employees are permitted to use a certain number of shares of restricted stock to cover their personal tax liability for restricted stock awards. We paid approximately $499 thousand, $342 thousand and $314 thousand, to cover this liability in the years ended December 31, 2016, 2015 and 2014, respectively. These payments are classified as financing cash flows on the consolidated statements of cash flows. As of December 31, 2016, the total compensation cost related to non-vested awards not yet recognized was approximately $1.1 million with a weighted average amortization period of 1.9 years.
Stock-based compensation consisted of restricted stock awards, was included in costs and operating expenses and the following line items on the accompanying statements of income for the years ended December 31, 2016, 2015 and 2014 (in thousands):
|
| | | | | | | | | | | |
| 2016 | | 2015 | | 2014 |
Stock-based compensation included in costs and operating expenses | $ | 2,109 |
| | $ | 2,081 |
| | $ | 1,739 |
|
Income tax benefit recognized for stock-based compensation | (811 | ) | | (800 | ) | | (669 | ) |
Total stock-based compensation expense, net of income tax benefit | $ | 1,298 |
| | $ | 1,281 |
| | $ | 1,070 |
|
(10) Income Taxes
We are subject to U.S. federal income tax as well as income tax in multiple state and local jurisdictions. We have concluded all U.S. federal income tax matters as well as material state and local tax matters for years through 2012.
We file consolidated federal income tax returns that include all of our subsidiaries. The components of the provision for income taxes from continuing operations for the years ended December 31, 2016, 2015 and 2014 are as follows (in thousands):
|
| | | | | | | | | | | |
| 2016 | | 2015 | | 2014 |
Current | | | | | |
Federal | $ | 13,648 |
| | $ | 13,641 |
| | $ | 7,889 |
|
State | 2,379 |
| | 2,352 |
| | 1,486 |
|
| 16,027 |
| | 15,993 |
| | 9,375 |
|
Deferred | |
| | |
| | |
|
Federal | (983 | ) | | 73 |
| | 2,595 |
|
State | (163 | ) | | 11 |
| | 488 |
|
| (1,146 | ) | | 84 |
| | 3,083 |
|
Provision for income taxes | $ | 14,881 |
| | $ | 16,077 |
| | $ | 12,458 |
|
The differences between the amount of tax computed at the federal statutory rate of 35% and the provision for income taxes from continuing operations for the years ended December 31, 2016, 2015 and 2014 are as follows (in thousands):
|
| | | | | | | | | | | |
| 2016 | | 2015 | | 2014 |
Tax at statutory federal income tax rate | $ | 14,586 |
| | $ | 14,348 |
| | $ | 11,531 |
|
Increases (decreases) in tax resulting from: | |
| | |
| | |
|
State taxes, net of federal tax benefit | 1,599 |
| | 1,683 |
| | 1,486 |
|
Permanent differences, net | (974 | ) | | 88 |
| | (516 | ) |
Other, net | (330 | ) | | (42 | ) | | (43 | ) |
Provision for income taxes | $ | 14,881 |
| | $ | 16,077 |
| | $ | 12,458 |
|
The tax effect of temporary differences representing deferred tax assets and liabilities as of December 31, 2016 and 2015 are as follows (in thousands):
|
| | | | | | | |
| 2016 | | 2015 |
Gross deferred tax assets | | | |
Deferred compensation and accrued paid leave | $ | 7,602 |
| | $ | 6,943 |
|
Accrued expenses | 1,933 |
| | 2,228 |
|
Stock-based compensation | 803 |
| | 765 |
|
Interest rate swaps | — |
| | 47 |
|
Reserve for contract disallowances | 90 |
| | 119 |
|
Acquisition-related expenses | 452 |
| | 503 |
|
Capitalized inventory | 1,104 |
| | 1,080 |
|
State operating loss carryforward | 283 |
| | — |
|
Tax credit carryforward | 155 |
| | — |
|
Legal settlements | 614 |
| | — |
|
Other | 65 |
| | 3 |
|
Total gross deferred tax assets | 13,101 |
| | 11,688 |
|
| | | |
Gross deferred tax liabilities | | | |
Interest rate swaps | (28 | ) | | — |
|
Depreciation | (3,522 | ) | | (3,912 | ) |
Deferred revenues | (2,291 | ) | | (2,189 | ) |
Goodwill and intangible assets | (37,132 | ) | | (37,111 | ) |
Total gross deferred tax liabilities | (42,973 | ) | | (43,212 | ) |
| | | |
Net deferred tax liabilities | $ | (29,872 | ) | | $ | (31,524 | ) |
(11) Commitments and Contingencies
(a) Leases and Other Commitments
We have various non-cancelable operating leases for facilities, equipment, and software with terms between two and 15 years. The terms of the facilities leases typically provide for certain minimum payments as well as increases in lease payments based upon the operating cost of the facility and the consumer price index. Rent expense is recognized on a straight-line basis for rent agreements having escalating rent terms. Lease expense for the years ended December 31, 2016, 2015 and 2014 was as follows (in thousands):
|
| | | | | | | | | | | |
| Operating Lease Expense | | Sublease Income | | Net Expense |
2016 | $ | 5,100 |
| | $ | 888 |
| | $ | 4,212 |
|
2015 | $ | 5,824 |
| | $ | 506 |
| | $ | 5,318 |
|
2014 | $ | 6,576 |
| | $ | 119 |
| | $ | 6,457 |
|
Future minimum annual non-cancelable commitments as of December 31, 2016 are as follows (in thousands):
|
| | | | | | | | | | | |
| Operating Leases |
| Lease Commitments | | Sublease Income | | Net Commitments |
2017 | $ | 3,504 |
| | $ | — |
| | $ | 3,504 |
|
2018 | 2,038 |
| | — |
| | 2,038 |
|
2019 | 837 |
| | — |
| | 837 |
|
2020 | 312 |
| | — |
| | 312 |
|
2021 | 114 |
| | — |
| | 114 |
|
Thereafter | 5 |
| | — |
| | 5 |
|
Total | $ | 6,810 |
| | $ | — |
| | $ | 6,810 |
|
We signed a lease in 2009 for a building to serve as our headquarters with a rent commencement date of May 1, 2012. Certain terms in the lease agreement resulted in the capitalization of construction costs due to specific accounting rules. We recorded a construction asset and corresponding long-term liability of approximately $27.3 million on May 1, 2012, which represents the construction costs incurred by the landlord as of that date. According to accounting rules, we have forms of continuing involvement that require us to account for this transaction as a financing lease upon commencement of the lease period. The building and building improvements are included on our consolidated balance sheet and are being depreciated over a 15-year period. Payments made under the lease agreement are applied to service the financing obligation and interest expense based on an imputed interest rate amortizing the obligation over the life of the lease agreement.
Future minimum annual non-cancelable commitments under our headquarters lease as of December 31, 2016, which are not included in the table above, are as follows (in thousands):
|
| | | | | | | | | | | |
| Lease Commitments | | Sublease Income | | Net Commitments |
2017 | $ | 4,220 |
| | $ | 843 |
| | $ | 3,377 |
|
2018 | 4,337 |
| | 396 |
| | 3,941 |
|
2019 | 4,456 |
| | 376 |
| | 4,080 |
|
2020 | 4,579 |
| | — |
| | 4,579 |
|
2021 | 4,705 |
| | — |
| | 4,705 |
|
Thereafter | 27,163 |
| | — |
| | 27,163 |
|
Total | $ | 49,460 |
| | $ | 1,615 |
| | $ | 47,845 |
|
(b) Contingencies
Anchorage Litigation and Related Proceedings
In March 2013, a lawsuit, Anchorage vs. Integrated Concepts and Research Corporation, et al., was filed in the Superior Court for the State of Alaska at Anchorage by the Municipality of Anchorage, Alaska (“MOA”) against our subsidiary Integrated Concepts and Research Corporation (“ICRC”) and two former subcontractors of ICRC (the “Anchorage Lawsuit”). The Anchorage Lawsuit asserted breach of contract, professional negligence and negligence in respect of services ICRC performed under its Port of Anchorage Intermodal Expansion Contract with the United States Maritime Administration. ICRC’s contract with the Maritime Administration expired in May 2012. In April 2013, the Anchorage Lawsuit was removed to the United States District Court for the District of Alaska.
In August 2015, a lawsuit, The Charter Oak Fire Insurance Company, The Travelers Indemnity Company of Connecticut and Travelers Property Casualty Company of America vs. Integrated Concepts and Research Corporation, VSE Corporation and Municipality of Anchorage, was filed against VSE and ICRC in the United States District Court for the District of Alaska (the “Coverage Lawsuit”). The plaintiff insurance companies were seeking (a) a declaration by the court that there was no defense or indemnity coverage available to ICRC and VSE for the Anchorage Lawsuit under the insurance policies issued by the plaintiffs and (b) reimbursement of legal fees and costs incurred by the plaintiffs in the defense of uncovered claims in respect of the Anchorage Lawsuit.
On or about January 25, 2017 ICRC, our insurers and MOA fully settled the Anchorage Lawsuit and Coverage Lawsuit. Pursuant to the settlements, ICRC and VSE were released from pending claims in both lawsuits and ICRC and our insurers paid MOA approximately $3.8 million, of which $3.0 million was provided by our insurers. The United States District Court approved these lawsuit settlements in February 2017 and dismissed both lawsuits.
On or about September 9, 2016, ICRC filed a claim with the Civilian Board of Contract Appeals (“Board”) against the Maritime Administration for payment of contract closeout costs that were incurred by ICRC in respect of two Port of Anchorage Intermodal Expansion Contracts (the “Contracts”), and legal costs related to the Anchorage Lawsuit. On January 6, 2017, ICRC and the Maritime Administration agreed to a settlement, which the Board approved. Pursuant to the settlement, the U.S. Government paid ICRC $10.4 million in February 2017 in full satisfaction of contract closeout costs, including interest and any legal costs or damages arising out of ICRC’s work under the Contracts and the Anchorage Lawsuit. The majority of the Maritime Administration payment satisfies VSE's accounts receivable for work performed by ICRC in prior periods.
Heritage Disposal Litigation
In February 2015, a lawsuit, Heritage Disposal & Storage, L.L.C. vs. VSE Corporation, was filed against VSE in the United States District Court for the District of Nebraska (the "Heritage Litigation"). In November 2015, the Heritage Litigation was removed to the United States District Court for the Eastern District of Virginia. The complaint asserted that VSE had not fully paid Heritage for firework storage services rendered by Heritage during the period of October 2010 through August 2015 as a subcontractor under VSE's contract with the U.S. Bureau of Alcohol, Tobacco, Firearms and Explosives for the storage of fireworks seized by the Government. In June 2016, the jury in the Heritage Litigation awarded Heritage damages of approximately $4.8 million, exclusive of interest to be determined by the Court. On January 24, 2017, the United States District Court reduced the jury's award against VSE to approximately $3.5 million and denied Heritage’s request for prejudgment interest. On February 10, 2017, VSE and Heritage entered into an agreement in respect of the Heritage Litigation pursuant to which VSE paid approximately $3.3 million to Heritage in full settlement of the lawsuit.
During the course of the Heritage Litigation, VSE obtained evidence that invoices provided by Heritage under our predecessor contract with the U.S. Department of Treasury (the "Treasury Department") were possibly based on Heritage's improper inflation of the weight of certain seized fireworks stored by Heritage. We filed a voluntary disclosure of this matter with the Inspector General of the Treasury Department in June 2016. We estimated that the possible overbilling of the Government based on Heritage's improper inflation of the weight of seized fireworks stored by Heritage may be approximately $1.5 million. As a result of the United States District Court’s determination in the Heritage Litigation that the jury rejected that Heritage was engaged in a fraudulent billing scheme and that the Government was involved with the original weight estimates, we have determined that VSE did not overbill the Government. In February 2017 we notified the Government that we believe the voluntary disclosure matter is closed, but that we will continue to cooperate with the Government if it decides to continue investigating this matter.
Hawaii Litigation
In May 2012, four complaints were filed in the Circuit Court of the First Circuit, State of Hawaii, by the estates of five deceased individuals and certain of their relatives against VSE and certain other entities and individuals for unspecified damages. The complaints allege, among other things, that the explosion of fireworks and diesel fuel that injured and killed the five individuals in April 2011 was caused by negligence, actions and omissions of VSE and the other defendants and their employees, agents and representatives. The five deceased plaintiffs were employees of Donaldson Enterprises, Inc., which was a vendor retained by VSE to store and dispose of fireworks and other explosives seized by the federal government from entities and individuals illegally in possession of the fireworks and other explosives. VSE had a prime contract with the Treasury Department to support the management and disposal of seized assets, including fireworks and other explosives. VSE has denied the allegations and, together with its insurance carriers, will aggressively defend the proceedings, which are expected to proceed to trial in October 2017. While the results of legal proceedings cannot be predicted with certainty, we do not anticipate that this lawsuit will have a material adverse effect on our results of operations, financial condition, or cash flows.
Aviation Litigation
On or about November 30, 2016, a lawsuit, Arrieta et al vs. Prime Turbines LLC et al, was filed in the District Court of Texas in Dallas County, by Edgar Arrieta, and four other plaintiffs against VSE's subsidiaries, Kansas Aviation of Independence, L.L.C. (“Kansas Aviation”) and Prime Turbines LLC (“Prime”) and three other unrelated defendants. The other named defendants are Pratt & Whitney of Canada Corporation, Cessna Aircraft Company and Woodward Inc. The Plaintiffs allege that on April 1, 2016, a plane crashed in Mexico, resulting in the death of one plaintiff and serious injuries to two other plaintiffs. Plaintiffs allege that Kansas Aviation and Prime were negligent in providing maintenance, service and inspection of the airplane engine and/or component parts prior to the crash. Plaintiffs state they are seeking monetary relief over $1.0 million from the defendants. Trial
is scheduled for May 2018. We have denied the allegations and, together with our insurance carrier, will aggressively defend the proceedings. While the results of legal proceedings cannot be predicted with certainty, we do not anticipate that this lawsuit will have a material adverse effect on our results of operation, financial condition, or cash flows.
In addition to the above-referenced legal proceedings, we may have certain claims in the normal course of business, including legal proceedings, against us and against other parties. In our opinion, the resolution of these other claims will not have a material adverse effect on our results of operations, financial position, or cash flows. However, the results of any legal proceedings cannot be predicted with certainty, therefore, the amount of loss, if any, cannot be reasonably estimated.
Further, from time-to-time, government agencies investigate whether our operations are being conducted in accordance with applicable contractual and regulatory requirements. Government investigations of us, whether relating to government contracts or conducted for other reasons, could result in administrative, civil or criminal liabilities, including repayments, fines or penalties being imposed upon us, or could lead to suspension or debarment from future government contracting. Government investigations often take years to complete and many result in no adverse action against us. We believe, based upon current information, that the outcome of any such government disputes and investigations will not have a material adverse effect on our results of operations, financial position, or cash flows.
(12) Business Segments and Customer Information
Segment Information
Management of our business operations is conducted under four reportable operating segments:
Supply Chain Management Group – Our Supply Chain Management Group supplies vehicle parts primarily through a Managed Inventory Program ("MIP") and direct sales to the United States Postal Service ("USPS") and to other customers.
Aviation Group – Our Aviation Group provides MRO services, parts supply and distribution, and supply chain solutions for general aviation jet aircraft engines and engine accessories.
Federal Services Group – Our Federal Services Group provides engineering, industrial, logistics, foreign military sales, and legacy equipment sustainment services to the United States Department of Defense ("DoD") and other government agencies.
IT, Energy and Management Consulting Group – Our IT, Energy and Management Consulting Group provides technical and consulting services primarily to various DoD and civilian government agencies.
These segments operate under separate management teams and financial information is produced for each segment. The entities within the IT, Energy and Management Consulting Group reportable segment meet the aggregation of operating segments criteria as defined by the accounting standard for segment reporting. We evaluate segment performance based on consolidated revenues and operating income. Net sales of our business segments exclude intersegment sales as these activities are eliminated in consolidation.
Our segment information is as follows (in thousands):
|
| | | | | | | | | | | |
For the years ended December 31, | | | | | |
| 2016 | | 2015 | | 2014 |
Revenues | | | | | |
Supply Chain Management Group | $ | 205,475 |
| | $ | 196,772 |
| | $ | 172,482 |
|
Aviation Group | 133,466 |
| | 119,729 |
| | — |
|
Federal Services Group | 306,109 |
| | 166,973 |
| | 190,761 |
|
IT, Energy and Management Consulting Group | 46,740 |
| | 50,508 |
| | 60,828 |
|
Total revenues | $ | 691,790 |
| | $ | 533,982 |
| | $ | 424,071 |
|
| | | | | |
Operating income: | |
| | |
| | |
|
Supply Chain Management Group | $ | 34,632 |
| | $ | 35,453 |
| | $ | 29,694 |
|
Aviation Group | 12,823 |
| | 10,635 |
| | — |
|
Federal Services Group | 4,185 |
| | 2,071 |
| | 3,452 |
|
IT, Energy and Management Consulting Group | 3,611 |
| | 4,731 |
| | 6,634 |
|
Corporate | (3,722 | ) | | (2,351 | ) | | (2,850 | ) |
Operating income | $ | 51,529 |
| | $ | 50,539 |
| | $ | 36,930 |
|
| | | | | |
Depreciation and amortization expense: | |
| | |
| | |
|
Supply Chain Management Group | $ | 6,445 |
| | $ | 7,074 |
| | $ | 5,373 |
|
Aviation Group | 5,461 |
| | 5,865 |
| | — |
|
Federal Services Group | 12,752 |
| | 10,635 |
| | 11,320 |
|
IT, Energy and Management Consulting Group | 1,388 |
| | 1,967 |
| | 2,077 |
|
Total depreciation and amortization | $ | 26,046 |
| | $ | 25,541 |
| | $ | 18,770 |
|
| | | | | |
Capital expenditures: | |
| | |
| | |
|
Supply Chain Management Group | $ | 4,195 |
| | $ | 7,544 |
| | $ | 2,524 |
|
Aviation Group | 1,459 |
| | 959 |
| | — |
|
Federal Services Group | 85 |
| | 78 |
| | 230 |
|
IT, Energy and Management Consulting Group | 9 |
| | 16 |
| | 199 |
|
Corporate | 1,624 |
| | 1,965 |
| | 461 |
|
Total capital expenditures | $ | 7,372 |
| | $ | 10,562 |
| | $ | 3,414 |
|
|
| | | | | | | |
| December 31, |
| 2016 | | 2015 |
Total assets: | | | |
Supply Chain Management Group | $ | 185,004 |
| | $ | 188,352 |
|
Aviation Group | 291,500 |
| | 263,226 |
|
Federal Services Group | 60,506 |
| | 38,772 |
|
IT, Energy and Management Consulting Group | 47,043 |
| | 47,000 |
|
Corporate | 77,786 |
| | 80,004 |
|
Total assets | $ | 661,839 |
| | $ | 617,354 |
|
Revenues are net of inter-segment eliminations. Corporate expenses are primarily selling, general and administrative expenses not allocated to segments. Included in our Corporate expenses for 2016 is a charge of approximately $3.3 million for the settlement of the Heritage Litigation offset by a gain of approximately $1.4 million resulting primarily from the Maritime Administration contract close-outs. Corporate assets are primarily cash and property and equipment.
Customer Information
Our revenues are derived from contract services performed for DoD agencies or federal civilian agencies and from the delivery of products to our clients. The USPS, U.S. Army and Army Reserve, and U.S. Navy are our largest customers. Our
customers also include various other government agencies and commercial entities. Our revenue by customer is as follows for the years ended December 31, (in thousands):
|
| | | | | | | | | | | | | | | | | | |
| | Revenues by Customer Years ended December 31, |
Customer | | 2016 | | % | | 2015 | | % | | 2014 | | % |
U. S. Postal Service | | $ | 181,215 |
| | 26.2 | | $ | 184,876 |
| | 34.6 | | $ | 167,268 |
| | 39.4 |
| | | | | | | | | | | | |
U.S. Navy | | 190,155 |
| | 27.5 | | 98,887 |
| | 18.5 | | 88,007 |
| | 20.7 |
U.S. Army | | 139,764 |
| | 20.2 | | 80,086 |
| | 15.0 | | 101,714 |
| | 24.0 |
U.S. Air Force | | 3,482 |
| | 0.5 | | 3,558 |
| | 0.7 | | 3,323 |
| | 0.8 |
Total - DoD | | 333,401 |
| | 48.2 | | 182,531 |
| | 34.2 | | 193,044 |
| | 45.5 |
| | | | | | | | | | | | |
Commercial Aviation | | 131,067 |
| | 19.0 | | 119,729 |
| | 22.4 | | — |
| | — |
Other Commercial | | 10,721 |
| | 1.5 | | 4,653 |
| | 0.9 | | 3,680 |
| | 0.9 |
Total - Commercial | | 141,788 |
| | 20.5 | | 124,382 |
| | 23.3 | | 3,680 |
| | 0.9 |
| | | | | | | | | | | | |
Department of Energy | | 11,708 |
| | 1.7 | | 16,020 |
| | 3.0 | | 19,000 |
| | 4.5 |
Social Security Administration | | 9,762 |
| | 1.4 | | 9,666 |
| | 1.8 | | 10,153 |
| | 2.4 |
Other Government | | 13,916 |
| | 2.0 | | 16,507 |
| | 3.1 | | 30,926 |
| | 7.3 |
Total - Other Civilian Agencies | | 35,386 |
| | 5.1 | | 42,193 |
| | 7.9 | | 60,079 |
| | 14.2 |
| | | | | | | | | | | | |
Total | | $ | 691,790 |
| | 100.0 | | $ | 533,982 |
| | 100.0 | | $ | 424,071 |
| | 100.0 |
We do not measure revenue or profit by product or service lines, either for internal management or external financial reporting purposes, because it would be impractical to do so. Products offered and services performed are determined by contract requirements and the types of products and services provided for one contract bear no relation to similar products and services provided on another contract. Products and services provided vary when new contracts begin or current contracts expire. In many cases, more than one product or service is provided under a contract or contract task order. Accordingly, cost and revenue tracking is designed to best serve contract requirements and segregating costs and revenues by product or service lines in situations for which it is not required would be difficult and costly to both us and our customers.
Geographical Information
Revenue by geography is based on the billing address of the customer. Our revenue by geographic area is as follows (in thousands):
|
| | | | | | | | | | | | |
| | Years ended December 31, |
| | 2016 | | 2015 | | 2014 |
United States | | $ | 638,726 |
| | $ | 481,466 |
| | $ | 422,519 |
|
Other Countries (1) | | 53,064 |
| | 52,516 |
| | 1,552 |
|
Total revenue | | $ | 691,790 |
| | $ | 533,982 |
| | $ | 424,071 |
|
(1) No individual country, other than disclosed above, exceeded 10% of our total revenue for any period presented.
(13) Capital Stock
Common Stock
Our common stock has a par value of $0.05 per share. Proceeds from common stock issuances that are greater than $0.05 per share are credited to additional paid in capital. Holders of common stock are entitled to one vote per common share held on all matters voted on by our stockholders. Stockholders of record are entitled to the amount of dividends declared per common share held.
(14) 401(k) Plan and Profit Sharing Plan
We maintain a defined contribution plan under Section 401(k) of the Internal Revenue Code of 1986, as amended, that covers substantially all of our employees. Under the provisions of our 401(k) plan, employees' eligible contributions are matched at rates specified in the plan documents. Our expense associated with this plan was approximately $6.3 million, $4.8 million and $4.0 million for the years ended December 31, 2016, 2015, and 2014, respectively.
(15) Fair Value Measurements
The accounting standard for fair value measurements defines fair value, and establishes a market-based framework or hierarchy for measuring fair value. The standard is applicable whenever assets and liabilities are measured at fair value.
The fair value hierarchy established in the standard prioritizes the inputs used in valuation techniques into three levels as follows:
Level 1 – Observable inputs – quoted prices in active markets for identical assets and liabilities;
Level 2 – Observable inputs other than the quoted prices in active markets for identical assets and liabilities – includes quoted prices for similar instruments, quoted prices for identical or similar instruments in inactive markets, and amounts derived from valuation models where all significant inputs are observable in active markets; and
Level 3 – Unobservable inputs – includes amounts derived from valuation models where one or more significant inputs are unobservable and require us to develop relevant assumptions.
The following table summarizes the financial assets and liabilities measured at fair value on a recurring basis as of December 31, 2016 and December 31, 2015 and the level they fall within the fair value hierarchy (in thousands):
|
| | | | | | | | | | | | |
Amounts Recorded at Fair Value | | Financial Statement Classification | | Fair Value Hierarchy | | Fair Value December 31, 2016 | | Fair Value December 31, 2015 |
Non-COLI assets held in Deferred Supplemental Compensation Plan | | Other assets | | 1 | | $ | 299 |
| | $ | 264 |
|
Interest rate swaps | | Accrued expenses | | 2 | | $ | — |
| | $ | 123 |
|
Interest rate swaps | | Other current assets | | 2 | | $ | 73 |
| | $ | — |
|
Earn-out obligation-current | | Current portion of earn-out obligation | | 3 | | $ | — |
| | $ | 9,678 |
|
Earn-out obligation-long-term | | Earn-out obligation | | 3 | | $ | — |
| | $ | 10,166 |
|
Non-COLI assets held in the deferred supplemental compensation plan consist of equity funds with fair value based on observable inputs such as quoted prices for identical assets in active markets and changes in its fair value are recorded as selling, general and administrative expenses.
We account for our interest rate swap agreements under the provisions of ASC 815, Derivatives and Hedging, and have determined that our swap agreements qualify as cash flow hedges. Accordingly, the fair value of the swap agreements, which is an asset recorded in other current assets of approximately $73 thousand and a liability recorded in accrued expenses of approximately $123 thousand at December 31, 2016 and 2015, respectively. The offset, net of an income tax effect of approximately $28 thousand and $48 thousand is included in accumulated other comprehensive loss in the accompanying balance sheets as of December 31, 2016 and 2015, respectively. The amounts paid and received on the swap agreements are recorded in interest expense in the period during which the related floating-rate interest is incurred. We determine the fair value of the swap agreements based on a valuation model using market data inputs.
We utilized a probability-weighted discounted cash flow method to determine the fair value of our Aviation Acquisition post-closing earn-out obligation at December 31, 2015. Probabilities were applied to each potential pay-out scenario and the resulting values were discounted using a rate that considered our weighted average cost of capital, as well as a specific risk premium associated with the riskiness of the earn out itself, the related projections, and the overall business. Significant unobservable inputs used to value the contingent consideration include projected earnings before interest, taxes, depreciation and amortization and the discount rate. In July 2016, we reached an agreement with the sellers for an early termination and final payment of our post-closing
earn-out obligation. The final earn-out payment of $10.5 million was made in July 2016 (See Note 5, Acquisitions, for a discussion of the termination of our Aviation Acquisition earn-out obligation).
During the twelve months ended December 31, 2016, the fair value of the earn-out obligation related to the Aviation Acquisition decreased by approximately $1.3 million, which was recorded within cost and operating expenses.
The following table provides a reconciliation of the beginning and ending balance of the earn-out obligations measured at fair value on a recurring basis that used significant unobservable inputs (Level 3).
|
| | | | | | | | | | | |
| Current portion | | Long-term portion | | Total |
Balance as of December 31, 2015 | $ | 9,678 |
| | $ | 10,166 |
| | $ | 19,844 |
|
Earn-out payments | (18,515 | ) | | — |
| | (18,515 | ) |
Fair value adjustment included in net income | (1,608 | ) | | 279 |
| | (1,329 | ) |
Reclassification from long-term to current | 10,445 |
| | (10,445 | ) | | — |
|
Balance as of December 31, 2016 | $ | — |
| | $ | — |
| | $ | — |
|
(16) Discontinued Operations
During 2012 we discontinued the construction management operations of our subsidiary Integrated Concepts and Research Corporation ("ICRC").
Revenues and costs of ICRC have been reclassified as discontinued operations for all periods presented. The major categories included in discontinued operations on the consolidated statements of income are as follows (in thousands):
|
| | | | | |
| |
| | 2014 | |
Revenues | | $ | — |
| |
| | | |
Loss before income taxes | | $ | (1,807 | ) | |
Income benefit | | (683 | ) | |
Loss from discontinued operations, net | | $ | (1,124 | ) | |
(17) Selected Quarterly Data (Unaudited)
The following table shows selected quarterly data for 2016 and 2015, in thousands, except earnings per share.
|
| | | | | | | | | | | | | | | |
| 2016 Quarters |
| 1st | | 2nd | | 3rd | | 4th |
| | | | | | | |
Revenues | $ | 143,636 |
| | $ | 160,473 |
| | $ | 172,780 |
| | $ | 214,901 |
|
Costs and operating expenses | $ | 130,895 |
| | $ | 148,594 |
| | $ | 159,157 |
| | $ | 201,615 |
|
Operating income | $ | 12,741 |
| | $ | 11,879 |
| | $ | 13,623 |
| | $ | 13,286 |
|
Net income | $ | 6,552 |
| | $ | 5,969 |
| | $ | 7,088 |
| | $ | 7,184 |
|
| | | | | | | |
Basic earnings per share: | |
| | |
| | |
| | |
|
Net income | $ | 0.61 |
| | $ | 0.55 |
| | $ | 0.66 |
| | $ | 0.67 |
|
Basic weighted average shares outstanding | 10,778 |
| | 10,799 |
| | 10,799 |
| | 10,799 |
|
| | | | | | | |
Diluted earnings per share: | |
| | |
| | |
| | |
|
Net income | $ | 0.61 |
| | $ | 0.55 |
| | $ | 0.65 |
| | $ | 0.66 |
|
Diluted weighted average shares outstanding | 10,806 |
| | 10,826 |
| | 10,826 |
| | 10,853 |
|
|
| | | | | | | | | | | | | | | |
| 2015 Quarters |
| 1st | | 2nd | | 3rd | | 4th |
| | | | | | | |
Revenues | $ | 120,791 |
| | $ | 131,126 |
| | $ | 137,396 |
| | $ | 144,669 |
|
Costs and operating expenses | $ | 110,107 |
| | $ | 119,630 |
| | $ | 124,153 |
| | $ | 129,553 |
|
Operating income | $ | 10,684 |
| | $ | 11,496 |
| | $ | 13,243 |
| | $ | 15,116 |
|
Net income | $ | 5,220 |
| | $ | 5,479 |
| | $ | 6,474 |
| | $ | 7,745 |
|
| | | | | | | |
Basic earnings per share: | | | | | | | |
Net income | $ | 0.49 |
| | $ | 0.51 |
| | $ | 0.60 |
| | $ | 0.72 |
|
Basic weighted average shares outstanding | 10,739 |
| | 10,750 |
| | 10,750 |
| | 10,750 |
|
| | | | | | | |
Diluted earnings per share: | |
| | |
| | |
| | |
|
Net income | $ | 0.49 |
| | $ | 0.51 |
| | $ | 0.60 |
| | $ | 0.72 |
|
Diluted weighted average shares outstanding | 10,760 |
| | 10,782 |
| | 10,792 |
| | 10,814 |
|
ITEM 9. Changes in and Disagreements with Accountants on Accounting and Financial Disclosure
None.
ITEM 9A. Controls and Procedures
Evaluation of Disclosure Controls and Procedures
Our management has evaluated, with the participation of our Chief Executive Officer and Chief Financial Officer, the effectiveness of our disclosure controls and procedures (as defined in Rules 13a-15(e) and 15(d)-15(e) under the Securities Exchange Act of 1934, as amended (the "Exchange Act"). Based on this evaluation, our Chief Executive Officer and Chief Financial Officer have concluded that, as of such date, our disclosure controls and procedures were effective to ensure that information we are required to disclose in reports that we file or submit under the Exchange Act is recorded, processed, summarized and reported within the time periods specified in Securities and Exchange Commission rules and forms and that such information is accumulated and communicated to our management, including our Chief Executive Officer and Chief Financial Officer, as appropriate, to allow timely decisions regarding required disclosure.
Management's Report on Internal Control Over Financial Reporting
Management is responsible for establishing and maintaining adequate internal control over financial reporting, as such term is defined in Exchange Act Rules 13a-15(f) and 15d-15(f). Under the supervision and with the participation of our management, including our Chief Executive Officer and Chief Financial Officer, we conducted an assessment of the effectiveness of our internal control over financial reporting as of December 31, 2016 based on the framework in Internal Control – Integrated Framework issued by the Committee of Sponsoring Organizations of the Treadway Commission (2013 Framework). Based on our assessment under the framework in Internal Control – Integrated Framework, our management concluded that our internal control over financial reporting was effective as of December 31, 2016. Ernst & Young LLP, our independent registered public accounting firm, has issued an opinion on our internal control over financial reporting. This opinion appears in the Report of Independent Registered Public Accounting Firm set forth below.
Change in Internal Controls
During the fourth quarter of fiscal year 2016, there were no changes in our internal control over financial reporting (as defined in Rules 13a-15(f) and 15d-15(f) under the Exchange Act) that have materially affected these controls, or are reasonably likely to materially affect these controls subsequent to the evaluation of these controls.
Report of Independent Registered Public Accounting Firm
The Board of Directors and Stockholders of VSE Corporation
We have audited VSE Corporation and Subsidiaries’ internal control over financial reporting as of December 31, 2016, based on criteria established in Internal Control-Integrated Framework issued by the Committee of Sponsoring Organizations of the Treadway Commission (2013 framework) (the COSO criteria). VSE Corporation and Subsidiaries’ management is responsible for maintaining effective internal control over financial reporting, and for its assessment of the effectiveness of internal control over financial reporting included in the accompanying Management’s Report on Internal Control over Financial Reporting. Our responsibility is to express an opinion on the company’s internal control over financial reporting based on our audit.
We conducted our audit in accordance with the standards of the Public Company Accounting Oversight Board (United States). Those standards require that we plan and perform the audit to obtain reasonable assurance about whether effective internal control over financial reporting was maintained in all material respects. Our audit included obtaining an understanding of internal control over financial reporting, assessing the risk that a material weakness exists, testing and evaluating the design and operating effectiveness of internal control based on the assessed risk, and performing such other procedures as we considered necessary in the circumstances. We believe that our audit provides a reasonable basis for our opinion.
A company’s internal control over financial reporting is a process designed to provide reasonable assurance regarding the reliability of financial reporting and the preparation of financial statements for external purposes in accordance with generally accepted accounting principles. A company’s internal control over financial reporting includes those policies and procedures that (1) pertain to the maintenance of records that, in reasonable detail, accurately and fairly reflect the transactions and dispositions of the assets of the company; (2) provide reasonable assurance that transactions are recorded as necessary to permit preparation of financial statements in accordance with generally accepted accounting principles, and that receipts and expenditures of the company are being made only in accordance with authorizations of management and directors of the company; and (3) provide reasonable assurance regarding prevention or timely detection of unauthorized acquisition, use, or disposition of the company’s assets that could have a material effect on the financial statements.
Because of its inherent limitations, internal control over financial reporting may not prevent or detect misstatements. Also, projections of any evaluation of effectiveness to future periods are subject to the risk that controls may become inadequate because of changes in conditions, or that the degree of compliance with the policies or procedures may deteriorate.
In our opinion, VSE Corporation and Subsidiaries maintained, in all material respects, effective internal control over financial reporting as of December 31, 2016, based on the COSO criteria.
We also have audited, in accordance with the standards of the Public Company Accounting Oversight Board (United States), the consolidated balance sheets of VSE Corporation and Subsidiaries as of December 31, 2016 and 2015, and the related consolidated statements of income, comprehensive income, stockholders’ equity and cash flows for each of the three years in the period ended December 31, 2016 of VSE Corporation and Subsidiaries and our report dated March 1, 2017 expressed an unqualified opinion thereon.
/s/ Ernst & Young LLP
|
| |
McLean, Virginia | |
March 1, 2017 | |
ITEM 9B. Other Information
None.
PART III
Except as otherwise indicated below, the information required by Items 10, 11, 12, 13 and 14 of Part III of Form 10-K has been omitted in reliance of General Instruction G(3) to Form 10-K and is incorporated herein by reference to our definitive proxy statement to be filed with the SEC not later than 120 days after December 31, 2016 in respect of the Annual Meeting of VSE's stockholders scheduled to be held on May 2, 2017 (the "Proxy Statement").
ITEM 10. Directors, Executive Officers and Corporate Governance
See Item 4 under the caption "Executive Officers of Registrant," and the remaining information required by this Item is incorporated by reference to the Proxy Statement.
ITEM 11. Executive Compensation
The information required by this Item is incorporated by reference to the Proxy Statement.
ITEM 12. Security Ownership of Certain Beneficial Owners and Management and Related Stockholder Matters
Except for the "Equity Compensation Plan Information" disclosed in Item 5(e) above, the information required by this Item is incorporated by reference to the Proxy Statement.
ITEM 13. Certain Relationships and Related Transactions, and Director Independence
The information required by this Item is incorporated by reference to the Proxy Statement.
ITEM 14. Principal Accountant Fees and Services
The information required by this Item is incorporated by reference to the Proxy Statement.
PART IV
ITEM 15. Exhibits and Financial Statement Schedules
1.Financial Statements
The consolidated financial statements are listed under Item 8 of this Form 10-K.
2.Supplemental Financial Statement Schedules
All schedules have been omitted because they are not applicable, not required, or the information has been otherwise supplied in the financial statements or notes to the financial statements.
3.Exhibits
See "Exhibit Index" hereinafter contained and incorporated by reference.
SIGNATURES
Pursuant to the requirements of Section 13 or 15(d) of the Securities Exchange Act of 1934, Registrant has duly caused this report to be signed on its behalf by the undersigned, thereunto duly authorized.
|
| | | |
| | | VSE CORPORATION |
| | | |
Date: | March 1, 2017 | By: | /s/ M. A. Gauthier |
| | | M. A. Gauthier |
| | | Chief Executive Officer, |
| | | President and Chief Operating |
| | | Officer |
Pursuant to the requirements of the Securities Exchange Act of 1934, this report has been signed by the following persons on behalf of Registrant and in the capacities and on the dates indicated.
|
| | |
Name | Title | Date |
| | |
| | |
/s/ Maurice A. Gauthier | Director, Chief Executive | March 1, 2017 |
Maurice A. Gauthier | Officer, President and | |
| Chief Operating Officer | |
| | |
| | |
/s/ Thomas R. Loftus | Executive Vice President | March 1, 2017 |
Thomas R. Loftus | and Chief Financial Officer | |
| (Principal Financial and | |
| Accounting Officer) | |
| | |
| | |
/s/ Clifford M. Kendall | Chairman/Director | March 1, 2017 |
Clifford M. Kendall | | |
| | |
| | |
/s/ Calvin S. Koonce | Director | March 1, 2017 |
Calvin S. Koonce | | |
| | |
| | |
/s/ James F. Lafond | Director | March 1, 2017 |
James F. Lafond | | |
| | |
| | |
/s/ Bonnie K. Wachtel | Director | March 1, 2017 |
Bonnie K. Wachtel | | |
| | |
| | |
/s/ Ralph E. Eberhart | Director | March 1, 2017 |
Ralph E. Eberhart | | |
| | |
| | |
/s/ Jack C. Stultz | Director | March 1, 2017 |
Jack C. Stultz | | |
| | |
| | |
/s/ John E. Potter | Director | March 1, 2017 |
John E. Potter | | |
| | |
| | |
/s/ John C. Harvey | Director | March 1, 2017 |
John C. Harvey | | |
|
| | |
| EXHIBIT INDEX | |
| | |
Reference No. Per Item 601 of Regulation S-K | Description of Exhibit | Exhibit No. In this Form 10-K |
| | |
3.1 | Certificate of incorporation and by-laws Restated Certificate of Incorporation of VSE Corporation dated as of February 6, 1996 (Exhibit 3.2 to Form 10-K405 dated March 25, 1996) | * |
3.2 | By-Laws of VSE Corporation as amended through December 17, 2008 (Exhibit 3.1 to Form 8-K dated December 17, 2008) | * |
4.1 | Instruments defining the rights of security holders, including indentures Specimen Stock Certificate as of May 19, 1983 (Exhibit 4 to Registration Statement No. 2-83255 dated April 22, 1983 on Form S-2) | * + |
10.1 | Material contracts | |
10.2 | Employment Agreement dated as of July 1, 2004, by and between VSE Corporation and Thomas R. Loftus (Exhibit 10.1 to Form 10-Q dated July 30, 2004) | * + |
10.3 | Amended and Restated Employment Agreement dated as of December 6, 2013 by and between VSE Corporation and Maurice A. Gauthier (Exhibit 10.3 to Form 10-Q dated April 29, 2016); and Amendment Agreement dated as of December 14, 2016 by and between VSE Corporation and Maurice A. Gauthier (Exhibit 10.1 to Form 8-K dated December 9, 2016) | * + |
10.4 | Severance and Mutual Protection Agreement dated as of November 7, 2008, by and between VSE Corporation and Thomas M. Kiernan (Exhibit 10.3 to Form 10-K dated March 3, 2009) | * + |
10.5 | Third Amended and Restated Business Loan and Security Agreement dated January 28, 2015 among VSE Corporation and its wholly owned subsidiaries, Citizens Bank of Pennsylvania and a syndicate of five other banks (Exhibit 10.1 to Form 8-K dated January 30, 2015) | * |
10.6 | Lease Agreement by and between Metropark 7 LLC and VSE Corporation (Exhibit 10.2 to Form 8-K dated November 4, 2009) | * |
10.7 | VSE Corporation Deferred Supplemental Compensation Plan effective January 1, 1994 as amended by the Board through March 9, 2004 (Exhibit 10.2 to Form 10-Q dated April 28, 2004) | * + |
10.8 | VSE Corporation 2004 Non-Employee Directors Stock
Plan (Appendix B to Registrant's definitive
proxy statement for the Annual Meeting of
Stockholders held on May 6, 2014) | * + |
13.1 | Annual report to security holders, Form 10-Q
or selected quarterly data | Exhibit 13 |
21.1 | Subsidiaries of the Registrant | Exhibit 21 |
23.1 | Consent of Ernst & Young LLP, independent
registered public accounting firm | Exhibit 23.1 |
31.1 | Section 302 CEO Certification | Exhibit 31.1 |
31.2 | Section 302 CFO and PAO Certification | Exhibit 31.2 |
|
| | |
32.1 | Section 906 CEO Certification | Exhibit 32.1 |
32.2 | Section 906 CFO and PAO Certification | Exhibit 32.2 |
99.1 | Audit Committee Charter (as adopted by the Board
Of Directors of VSE Corporation on March 9,
2004)(Appendix A to Registrant's definitive
proxy statement for the Annual Meeting of
Stockholders held on May 3, 2004) | * |
101.INS | XBRL Instance Document | |
101.SCH | XBRL Taxonomy Extension Schema Document | |
101.CAL | XBRL Taxonomy Extension Calculation Linkbase Document | |
101.DEF | XBRL Taxonomy Extension Definition Linkbase Document | |
101.LAB | XBRL Taxonomy Extension Label Linkbase Document | |
101.PRE | XBRL Taxonomy Extension Presentation Linkbase Document | |
*Document has been filed as indicated and is incorporated by reference herein.
+Indicates management contract or compensatory plan or arrangement.