United
States
SECURITIES
AND EXCHANGE COMMISSION
Washington,
D.C. 20549
Form
10-K
ANNUAL
REPORT PURSUANT TO SECTION 13 OR 15(d) OF
THE
SECURITIES EXCHANGE ACT OF 1934
For the
fiscal year ended December 31, 2009
Commission
file number 0-3676
VSE
CORPORATION
(Exact
name of registrant as specified in its charter)
|
Delaware
|
54-0649263
|
|
|
(State
or other jurisdiction of
incorporation
or organization)
|
(I.R.S.
Employer
Identification
No.)
|
2550
Huntington Avenue, Alexandria, VA 22303-1499 (703/960-4600)
(Address
and telephone number of principal executive offices)
Securities
registered pursuant to Section 12(b) of the Act:
|
Title
of Each Class
|
Name
of each exchange on which registered
|
|
|
Common
Stock, $0.05 par value
|
The
NASDAQ Global Select Market
|
Securities
registered pursuant to Section 12(g) of the Act: None
Indicate
by check mark if the registrant is a well-known seasoned issuer, as defined in
Rule 405 of the Securities Act. Yes ¨ No
x
Indicate
by check mark if the registrant is not required to file reports pursuant to
Section 13 or Section 15(d) of the Act. Yes ¨ No
x
Indicate
by check mark whether the registrant (1) has filed all reports required to
be filed by Section 13 or 15(d) of the Securities Exchange Act of 1934
during the preceding 12 months, and (2) has been subject to such filing
requirements for the past 90 days. Yes x No
¨
Indicate
by check mark whether the registrant has submitted electronically and posted on
its corporate Web site, if any, every Interactive Data File required to be
submitted and posted pursuant to Rule 405 of Regulation S-T(section 232.405 of
this chapter) during the preceding 12 months (or for such shorter period that
the registrant was required to submit and post such files). Yes ¨ No
¨
Indicate
by check mark if the disclosure of delinquent filers pursuant to Item 405
of Regulation S-K is not contained herein, and will not be contained, to the
best of registrant’s knowledge, in definitive proxy or information statements
incorporated by reference in Part III of this Form 10-K or any amendment to this
Form 10-K. ¨
Indicate
by check mark whether the registrant is a large accelerated filer, an
accelerated filer, or a non-accelerated filer. See definition of “accelerated
filer” and “large accelerated filer” in Rule 12b-2 of the Exchange Act (check
one).
Large
accelerated filer ¨
Accelerated filer x
Non-accelerated filer ¨
Indicate
by check mark whether the registrant is a shell company (as defined in Rule
12-b2 of the Exchange
Act). Yes ¨ No x
State the
aggregate market value of the voting and non-voting common equity held by
non-affiliates computed by reference to the price at which the common equity was
last sold, or the average bid and asked price of such common equity, as of the
last business day of the registrant’s most recently completed second
quarter.
Approximately
$107.6 million as of June 30, 2009.
Indicate
the number of shares outstanding of each of the registrant’s classes of common
stock, as of the latest practicable date. Common Stock, $.05 par value,
5,175,080 shares outstanding as of March 4, 2010.
DOCUMENTS
INCORPORATED BY REFERENCE
Portions
of the Registrant's Proxy Statement for the Annual Meeting of Stockholders
expected to be held on May 4, 2010, are incorporated by reference into Part III
of this report.
2
TABLE
OF CONTENTS
|
Page
|
||
|
PART
I
|
||
|
ITEM
1.
|
Business
|
5
|
|
ITEM
1A
|
Risk
Factors
|
9
|
|
ITEM
1B.
|
Unresolved
Staff Comments
|
12
|
|
ITEM
2.
|
Properties
|
12
|
|
ITEM
3.
|
Legal
Proceedings
|
12
|
|
ITEM
4.
|
Submission
of Matters to a Vote of Security Holders
|
12
|
|
Executive
Officers of the Registrant
|
13
|
|
|
PART
II
|
||
|
ITEM
5.
|
Market
for Registrant’s Common Equity, Related Stockholder
Matters
and Issuer Purchases of Equity Securities
|
16
|
|
ITEM
6.
|
Selected
Financial Data
|
19
|
|
ITEM
7.
|
Management’s
Discussion and Analysis of Financial
Condition
and Results of Operations
|
20
|
|
ITEM
7A.
|
Quantitative
and Qualitative Disclosures About
Market
Risks
|
37
|
|
ITEM
8.
|
Financial
Statements and Supplementary Data
|
38
|
|
ITEM
9.
|
Changes
in and Disagreements with Accountants on
Accounting
and Financial Disclosure
|
61
|
|
ITEM
9A.
|
Controls
and Procedures
|
61
|
|
ITEM
9B.
|
Other
Information
|
63
|
|
PART
III
|
||
|
ITEM
10.
|
Directors,
Executive Officers and Corporate Governance
|
63
|
|
ITEM
11.
|
Executive
Compensation
|
63
|
|
ITEM
12.
|
Security
Ownership of Certain Beneficial Owners and
Management
and Related Stockholder Matters
|
63
|
|
ITEM
13.
|
Certain
Relationships and Related Transactions, and
Director
Independence
|
63
|
|
ITEM
14.
|
Principal
Accountant Fees and Services
|
63
|
|
PART
IV
|
||
|
ITEM
15.
|
Exhibits,
Financial Statement Schedules
|
63
|
|
Signatures
|
65
|
|
|
Exhibits
|
67-75
|
3
Forward
Looking Statements
This
filing contains statements that, to the extent they are not recitations of
historical fact, constitute "forward looking statements" under federal
securities laws. All such statements are intended to be subject to
the safe harbor protection provided by applicable securities laws. For
discussions identifying some important factors that could cause actual VSE
Corporation (“VSE,” the “Company,” “us,” “our,” or “we”) results to differ
materially from those anticipated in the forward looking statements contained in
this filing, see VSE's “Narrative Description of Business” (Items 1, 1A, 2 and
3), and “Management’s Discussion and Analysis.” Readers are cautioned not to
place undue reliance on these forward looking statements, which reflect
management’s analysis only as of the date hereof. The Company undertakes no
obligation to publicly revise these forward looking statements to reflect events
or circumstances that arise after the date hereof. Readers should carefully
review the risk factors described in other documents the Company files from time
to time with the Securities and Exchange Commission, including Quarterly Reports
on Form 10-Q filed by the Company subsequent to this Annual Report on Form 10-K
and any Current Reports on Form 8-K filed by the Company.
4
ITEM
1. Business
|
(a)
|
General
Background
|
VSE was
incorporated in Delaware in 1959 and serves as a centralized management and
consolidating entity for our business operations. Our business operations are
managed under groups that perform our services. Our Federal Group consists of
our Communications and Engineering Division ("CED"), Engineering and Logistics
Division ("ELD"), Field Support Services Division (“FSS”), and Systems
Engineering Division ("SED"). Our International Group consists of our GLOBAL
Division ("GLOBAL") and Fleet Maintenance Division ("FMD"). Our IT, Energy and
Management Consulting Group consists of our wholly owned subsidiaries Energetics
Incorporated ("Energetics") and G&B Solutions, Inc. (“G&B"). Our
Infrastructure Group consists of our wholly owned subsidiary Integrated Concepts
and Research Corporation (“ICRC”). The term "VSE" or "Company" means VSE and its
subsidiaries and divisions unless the context indicates operations of the parent
company only.
Our
business operations consist primarily of diversified logistics, engineering, IT,
construction management and consulting services performed on a contract basis.
Almost all of our contracts are with agencies of the United States Government
(the "government") and other government prime contractors.
We seek
to provide our customers with competitive, cost-effective solutions to specific
problems. These problems generally require a detailed technical knowledge of
materials, processes, functional characteristics, information systems,
technology and products and an in-depth understanding of the basic requirements
for effective systems and equipment.
(b) Financial
Information
Our
operations are conducted within four reportable segments aligned with our
management groups: 1) Federal, which generated approximately 58% of our revenues
in 2009; 2) International, which generated approximately 31% of our revenues in
2009; 3) IT, Energy and Management Consulting, which generated approximately 7%
of our revenues in 2009; and 4) Infrastructure, which generated approximately 4%
of our revenues in 2009. Additional financial information for our reportable
segments appears in “Item 7. Management’s Discussion and Analysis of Financial
Condition and Results of Operations” and in “Item 8. Financial Statements and
Supplementary Data” of this Form 10-K.
(c) Description
of Business
Services
and Products
Our
services include a broad array of capabilities and resources that support
military, federal civil, and other government systems, equipment and processes.
We are focused on creating, sustaining and improving the systems, equipment and
processes of government through core offerings in logistics, engineering, IT,
construction management and consulting services.
Typical projects include sustaining
engineering support for military vehicles and combat trailers; military
equipment refurbishment and modification; ship maintenance, repair, overhaul
planning and follow-on technical support; logistics management support;
machinery condition analysis; specification preparation for ship alterations and
repairs; ship force crew training; life cycle support for ships; ship
communication systems; energy conservation and advanced technology demonstration
projects; technical data package preparation; multimedia, computer local area
network (“LAN”), and telecommunications systems; cross-platform technical data;
product data; technical manual development and support; information technology
management consulting, services, and solutions; and large-scale port engineering
development and construction management.
5
See Item 7 “Management’s Discussion and
Analysis of Financial Information and Results of Operations” for more
information regarding our business.
Contracts
Depending
on solicitation requirements and other factors, we offer our professional and
technical services and products through various competitive contract
arrangements and business units that are responsive to customer requirements and
may also provide an opportunity for diversification. Such arrangements may
include prime contracts, subcontracts, cooperative arrangements, General
Services Administration (“GSA”) schedules, dedicated cost centers (divisions)
and subsidiaries. Some of the contracts permit the contracting agency to issue
delivery orders or task orders in an expeditious manner to satisfy relatively
short-term requirements for engineering and technical
services.
Almost
all of our revenues are derived from contract services performed for Department
of Defense (“DoD”) agencies or for Federal Civil agencies. The U.S. Army, Army
Reserve and U.S. Navy are our largest customers. Other significant customers
include the Department of Treasury, the Department of Transportation, the
Department of Energy and the Department of Interior. To a lesser degree, our
customers also include various other government agencies and commercial
entities.
|
Revenues
by Customer
|
||||||||||||||||||||||||
|
(Dollars
in Thousands)
|
||||||||||||||||||||||||
|
Years
ended December 31,
|
||||||||||||||||||||||||
|
Customer
|
2009
|
%
|
2008
|
%
|
2007
|
%
|
||||||||||||||||||
|
U.S.
Army/Army Reserve
|
$ | 555,238 | 54.7 | $ | 625,237 | 59.9 | $ | 344,296 | 52.7 | |||||||||||||||
|
U.S.
Navy
|
271,189 | 26.7 | 195,792 | 18.8 | 189,534 | 29.0 | ||||||||||||||||||
|
U.S.
Air Force
|
13,839 | 1.4 | 10,720 | 1.0 | 4,628 | 0.7 | ||||||||||||||||||
|
Total
- DoD
|
840,266 | 82.8 | 831,749 | 79.7 | 538,458 | 82.4 | ||||||||||||||||||
|
Department
of U.S. Treasury
|
47,676 | 4.7 | 57,021 | 5.5 | 55,020 | 8.4 | ||||||||||||||||||
|
Department
of Transportation
|
35,722 | 3.5 | 89,873 | 8.6 | 30,977 | 4.7 | ||||||||||||||||||
|
Department
of Interior
|
29,275 | 2.9 | 19,156 | 1.8 | 1,053 | 0.2 | ||||||||||||||||||
|
Department
of Energy
|
16,111 | 1.6 | 12,812 | 1.2 | 10,537 | 1.6 | ||||||||||||||||||
|
Other
government
|
42,670 | 4.2 | 29,748 | 2.9 | 11,427 | 1.8 | ||||||||||||||||||
|
Total
– Federal Civil Agencies
|
171,454 | 16.9 | 208,610 | 20.0 | 109,014 | 16.7 | ||||||||||||||||||
|
Commercial
|
2,919 | 0.3 | 3,376 | 0.3 | 5,692 | 0.9 | ||||||||||||||||||
|
Total
|
$ | 1,014,639 | 100.0 | $ | 1,043,735 | 100.0 | $ | 653,164 | 100.0 | |||||||||||||||
The government’s procurement practices
sometimes include the bundling of various work efforts under large comprehensive
management contracts (“omnibus”). As a result, the growth opportunities
available to us can occur in significant, unpredictable increments. We have
pursued these larger opportunities by assembling teams of subcontractors to
offer the range of technical competencies required by these omnibus contracts.
Typically the use of subcontractors and large material purchases on government
contracts provides lower profit margins than work performed by our own
personnel. As a result, the use of such teaming arrangements may lower our
overall profit margins
in some years. Although the government’s practice of using omnibus multiple
award contracts is expected to continue, we also have opportunities to compete
for other contracts requiring our specific areas of expertise. We are positioned
to pursue these opportunities while continuing to use subcontractor teams to
compete for the omnibus contracts.
6
Our contracts with the government are
typically cost plus fee, time and materials, or fixed-price contracts. Revenues
result from work performed on these contracts by our own employees, from
pass-through of costs for work performed by our subcontractors, and for
materials. Revenues on cost-type contracts are recorded as contract allowable
costs are incurred and fees are earned.
Revenues
for time and materials contracts are recorded on the basis of contract allowable
labor hours worked multiplied by the contract defined billing rates, plus the
cost of materials used in performance on the contract. Profits or losses on time
and material contracts result from the difference between the cost of services
performed and the contract defined billing rates for these
services.
Revenue
recognition methods on fixed-price contracts vary depending on the nature of the
work and the contract terms. On design and development fixed-price contracts
revenues are recorded as costs are incurred, using the percentage-of-completion
method of accounting. Revenues on fixed-price service contracts are recorded as
work is performed, typically ratably over the service period. Revenues on
fixed-price contracts that require delivery of specific items may be recorded
based on a price per unit as units are delivered.
Backlog
Funded
backlog for government contracts represents a measure of our potential future
revenues. Funded backlog is defined as the total value of contracts that has
been appropriated and funded by the procuring agencies, less the amount of
revenues that have already been recognized on such contracts. Our funded backlog
as of December 31, 2009, is approximately $476 million. Funded backlog as of
December 31, 2008 and 2007 was approximately $567 million and $408 million,
respectively. Changes in funded backlog on contracts are sometimes unpredictable
due to uncertainties associated with changing government program priorities and
the ultimate availability of funds, which is heavily dependent upon the
congressional authorization and appropriation process. When there are
delays in this process, such as those experienced in 2009, the availability of
funds for ongoing and planned work is temporarily diminished.
In
addition to the funded backlog levels, we have contract ceiling amounts
available for use on multiple award, indefinite delivery, indefinite quantity
contracts with the U.S. Army, U.S. Air force, and U.S. Navy. While these
contracts increase the opportunities available for us to pursue future work, the
amount of future work is not determinable until delivery orders are placed on
the contracts. Frequently, these delivery orders are competitively
awarded. Additionally, these delivery orders must be funded by the procuring
agencies before we can perform work and begin generating revenues.
Marketing
Our marketing activities are conducted
at the operating group level by our business development staff and our
professional staff of engineers, program managers, and other personnel. These
activities are centrally coordinated through our Corporate Sales and Marketing
Department. Information concerning new programs and requirements becomes
available in the course of contract performance, through formal and informal
briefings, from participation in professional organizations, and from literature
published by the government, trade associations, professional organizations and
commercial entities.
7
Personnel
Services are provided by our staff of
professional and technical personnel having high levels of education,
experience, training and skills. As of December 31, 2009, we had 2,534
employees, an increase from 1,920 as compared to December 31, 2008. Principal
categories include (a) engineers and technicians in mechanical, electronic,
industrial, energy and environmental services, (b) information technology
professionals in computer systems, applications and products, configuration,
change and data management disciplines, (c) technical editors and writers, (d)
multimedia and computer design engineers, (e) graphic designers and technicians,
(f) logisticians, (g) construction and environmental specialists, and (h)
mechanics and vehicle and equipment technicians. The expertise required by our
customers also frequently includes knowledge of government administrative
procedures. Many of our employees have previously served as government employees
or members of the U.S. Armed Forces.
Competition
The professional and technical services
industry in which we are engaged is very competitive. There are numerous other
organizations, including large, diversified firms with greater financial
resources and larger technical staffs that are capable of providing the same
services offered by us. These companies may be publicly owned or privately held
or may also be divisions of much larger organizations.
Government agencies have emphasized
awarding contracts on a competitive basis as opposed to a sole source or other
noncompetitive basis. Most of the significant contracts that we currently
perform were either initially awarded on a competitive basis or have been
renewed at least once on a competitive basis. Government agencies also order
work through contracts awarded by General Services Administration (“GSA”). GSA
provides a schedule of services at fixed prices that may be ordered outside of
the solicitation process. We have nine GSA schedule contracts for different
classes of services. There is no assurance regarding the level of work we may
obtain under these contracts. Government budgets, and in particular the budgets
of certain government agencies, can also affect competition in our business. A
reallocation of government spending priorities or a general decline in
government budgets can result in lower levels of potential business, thereby
intensifying competition.
It is not possible to predict the
extent and range of competition that we will encounter as a result of changing
economic or competitive conditions, customer requirements or technological
developments. We believe the principal competitive factors for our business are
technical and financial qualifications, past performance and price.
Government acquisition policies and
procedures often emphasize factors that present challenges to our efforts to win
new business, and may make it difficult for us to qualify as a potential bidder.
For example, past performance may be used to exclude entrance into new
government markets, and multiple-award schedules may result in unequal contract
awards between successful contractors.
Available
Information
Copies of our Annual Reports on Form
10-K, Quarterly Reports on Form 10-Q, Current Reports on Form 8-K and amendments
to those reports are filed or furnished pursuant to Section 13(a) or 15(d) of
the Securities Exchange Act of 1934, as amended. They are available free of
charge through our website www.vsecorp.com as
soon as reasonably practicable after the reports are electronically filed with
the Securities and Exchange Commission (“SEC”).
8
ITEM
1A. Risk Factors
Our future results may differ
materially from past results and from those projected in the forward-looking
statements contained in this Form 10-K due to various uncertainties and risks,
including but not limited to those set forth below, one-time events and other
important factors disclosed previously and from time to time in our other
filings with the SEC.
The
nature of our operations and significant increases in work performed by our
employees in recent years present certain challenges related to work force
management.
Our
financial performance is heavily dependent on the abilities of our operating and
administrative staffs with respect to technical skills, operating performance,
pricing, cost management, safety, and administrative and compliance efforts. A
wider diversity of contract types, nature of work, work locations, and increased
legal and regulatory complexities challenges our administrative staff and skill
sets more than in prior years. Also, the recent increases and geographical
expansion in our domestic operating workforce presents challenges for our
quality of workforce, quality of work, safety, and labor relations compliance.
The scale of our current and projected work in foreign countries is exposing us
to new challenges associated with export compliance, local laws and customs,
third world workforce issues, extended supply chain, and war zone threats.
Failure to attract or retain an adequately skilled workforce, lack of knowledge
or training in critical functions, or inadequate staffing levels can result in
lost work, reduced profit margins, losses from cost overruns, performance
deficiencies, and regulatory non-compliance.
Our
work on large program efforts presents a risk to revenue and profit growth and
sustainability.
The
eventual expiration of large programs, or the loss of or disruption of revenues
on a single contract, presents the potential for reduced revenues and profits.
Such revenue losses could also erode profits on our remaining programs that
would have to absorb a larger portion of the fixed corporate costs previously
allocated to the expiring programs or discontinued contract work. While our
largest contract, the Rapid Response (“R2”) Program, is scheduled to expire in
January 2011, we expect to continue our work on existing task orders under such
contract through that time, however, specific task orders under the R2 contract
will expire intermittently prior to the expiration date of the contract. We have
submitted a bid for a follow-on to this contract that is currently under
evaluation by our U. S. Army customer. However, we cannot determine revenue
levels precisely even if we are awarded a follow-on contract.
We
are exposed to contractual and financial liabilities if our subcontractors do
not perform satisfactorily.
A large
percentage of our contract work is performed by subcontractors, which are
subject to government compliance, performance and financial risks. Subcontractor
terms generally specify the terms and performance for which the subcontractor is
obligated to us. If, however, any unsatisfactory performance or compliance
failure occurs on the part of subcontractors, we must still bear the cost to
remedy these deficiencies on our prime contracts.
Uncertain
and shifting federal government priorities could delay contract awards and
funding and adversely affect our ability to continue work on our government
contracts.
The
current federal procurement environment is unpredictable and could adversely
affect our ability to perform work on new and existing contracts. The delays in
contract awards during the second half of 2009 is unprecedented in our
experience, and appears to extend across the federal technical services
industry. We anticipate that these delays in
contract awards will continue into the
first half of 2010. Our business is subject to funding delays, terminations,
reductions, extensions, and moratoriums caused by political and administrative
disagreements and inefficiencies within the government.
9
Federal
procurement directives could result in a loss of work on current programs to
set-asides and omnibus contracts.
Our
government business is subject to the risk that one or more of our potential
contracts or contract extensions may be awarded by the contracting agency to a
small or disadvantaged or minority-owned business pursuant to set-aside programs
administered by the Small Business Administration, or may be bundled into
omnibus contracts for very large businesses. These risks can potentially have an
adverse effect on our revenue growth and profit margins.
As
a government contractor, we are subject to a number of procurement rules and
regulations that could expose us to potential liabilities or loss of
work.
We must
comply with and are affected by laws and regulations relating to the award,
administration and performance of government contracts. Additionally, we are
responsible for subcontractor compliance with these laws and regulations.
Government contract laws and regulations affect how we conduct business with our
customers and, in some instances, impose added costs to us. A violation of
specific laws and regulations could result in the imposition of fines and
penalties or the termination of contracts or debarment from bidding on
contracts.
In some
instances, these laws and regulations impose terms or rights that are
significantly more favorable to the government than those typically available to
commercial parties in negotiated transactions. For example, the government may
terminate any government contract or subcontract at its convenience, as well as
for performance default. Upon termination for convenience of a fixed-price type
contract, we would normally be entitled to receive the purchase price for
delivered items, reimbursement for allowable costs for work-in-process and an
allowance for profit on the contract or adjustment for loss if completion of
performance would have resulted in a loss. Upon termination for convenience of a
cost-type contract, we would normally be entitled to reimbursement of allowable
costs plus a portion of the fee. Such allowable costs would include the cost to
terminate agreements with suppliers and subcontractors. The amount of the fee
recovered, if any, is related to the portion of the work accomplished prior to
termination and is determined by negotiation.
A
termination for default could expose us to liability and have a material adverse
effect on our ability to compete for future contracts and orders. In addition,
the government could terminate a prime contract under which we are a
subcontractor, irrespective of the quality of services provided by us as a
subcontractor.
Our
business could be adversely affected by a negative audit by the
government.
Government
agencies, including the Defense Contract Audit Agency and the Department of
Labor, routinely audit and investigate government contractors. These agencies
review a contractor’s performance under its contracts, cost structure and
compliance with applicable laws, regulations and standards. The government also
may review the adequacy of, and a contractor’s compliance with, its internal
control systems and policies, including the contractor’s purchasing, property,
estimating, compensation and management information systems. Any costs found to
be improperly allocated to a specific contract will not be reimbursed, while
such costs already reimbursed must be refunded. If an audit uncovers improper or
illegal activities, we may be subject to civil and criminal penalties and
administrative sanctions, including termination of contracts, forfeiture of
profits, suspension of payments, fines and suspension or prohibition from doing
business with the government. In addition, we could suffer serious harm to our
reputation if allegations of impropriety were made.
10
Global
economic conditions and political factors could adversely affect revenues on
current programs.
Revenues from our CED Army Equipment
Support, CED Assured Mobility Systems Program, GLOBAL Ship Transfer and other
programs for which work is performed in foreign countries are subject to
political risks posed by the ongoing conflicts in the Middle East and potential
terrorist activity. A significant amount of our revenues in recent years has
resulted from the U.S. military involvement in Iraq and Afghanistan, and an end
to or substantial reduction of such U.S. military involvement could cause a
decrease in our revenues. Similarly, a change in the political landscape in
Egypt or other client countries could cause a decrease in our revenues.
International tensions can also affect our work by FMD on U.S. Navy ships when
they are deployed outside of U.S. Navy facilities and are unavailable for
maintenance work during those times. Adverse results arising from these global
economic and political risks could have a material adverse impact on our results
of operations.
Our
earnings and margins may vary based on the mix of contracts and
programs.
Our
business includes both cost-type and fixed-price contracts. Cost-type contracts
generally have lower profit margins than fixed-price contracts. Typically the
use of subcontractors and large material purchases on government contracts do
not allow for profit margins that are as high as profit margins from contracts
under which the work is performed by our own personnel. The use of
subcontractors and large material purchases may lower our overall profit margins
in some years.
Investments
in facilities could cause losses if certain work is disrupted or
discontinued.
We have
made investments in facilities and lease commitments to support specific
business programs, work requirements, and service offerings. A slowing or
disruption of these business programs, work requirements, or service offerings
that results in operating below intended levels could cause us to suffer
financial losses.
Environmental
and pollution risks could potentially impact our financial results.
We are
exposed to certain environmental and pollution risks due to the nature of some
of the contract work we perform. Costs associated with pollution clean up
efforts and environmental regulatory compliance have not yet had a material
adverse impact on our capital expenditures, earnings, or competitive position.
However, the occurrence of a future environmental or pollution event could
potentially have an adverse impact.
We
use estimates in accounting for our programs. Changes in estimates could affect
future financial results.
We use
estimates and assumptions that affect the reported amounts of assets and
liabilities and disclosure of contingent assets and liabilities at the date of
the financial statements and the reported amounts of revenues and expenses
during the reporting period. Actual results could differ from those estimates.
Significant estimates affecting the financial statements include contract
disallowance and self-insured health claims, and estimated cost-to- complete on
certain fixed-price contracts.
New
accounting standards could result in changes to our methods of quantifying and
recording accounting transactions, and could affect financial results and
financial position.
Changes
to Generally Accepted Accounting Principles in the United States (“GAAP”) arise
from new and revised guidance issued by the Financial Accounting Standards
Board, the SEC, and others. The effects of such changes may include prescribing
an accounting method where none had been previously specified, prescribing a
single acceptable method of accounting from among several acceptable methods
that currently exist, or revoking the acceptability of a current method and
replacing it with an entirely different method, among others. These changes
could result in unanticipated effects on results of operations, financial
position and other financial measures.
11
ITEM
1B. Unresolved Staff Comments
None
ITEM
2. Properties
Our
principal executive and administrative offices are located in a five-story
building in Alexandria, Virginia, leased by us through April 30, 2013. This
building contains approximately 127,000 square feet of engineering, shop, and
administrative space. In November 2009, we signed an agreement to lease a new
building with approximately 95,000 square feet of office space in Springfield,
Virginia that will serve as our new executive and administrative headquarters.
This agreement includes a 15-year lease commitment. We expect to take occupancy
of the building in the spring of 2012.
We also
provide services and products from approximately 37 leased facilities located
near customer sites to facilitate communications and enhance project
performance. These facilities are generally occupied under short-term leases and
currently include a total of approximately 1.4 million square feet of office and
warehouse space. Our employees often provide services at customer facilities,
limiting our requirement for additional space. We also provide services from
several locations outside of the United States, generally at foreign shipyards
or U.S. military installations.
We own
and operate two facilities in Ladysmith, Virginia. One of these properties
consists of approximately 44 acres of land and multiple storage and vehicle
maintenance buildings totaling approximately 57,000 square feet of space. The
other property consists of 30 acres of land and buildings totaling approximately
13,500 square feet of space. We use these properties primarily to provide
refurbishment services for military equipment, storage and maintenance and to
supplement our Alexandria, Virginia, office and shop facilities.
ITEM
3. Legal Proceedings
We may
have, in the normal course of business, certain claims, including legal
proceedings, against us and against other parties. In our opinion, the
resolution of these claims will not have a material adverse effect on our
results of operations or financial position. However, the results of any legal
proceedings cannot be predicted with certainty.
ITEM
4. Submission of Matters to a Vote of Security
Holders
No
matters were submitted to a vote of our stockholders, through the solicitation
of proxies or otherwise, during the three-month period ended December 31,
2009.
12
EXECUTIVE
OFFICERS OF THE REGISTRANT
Our
executive officers are listed below, as well as information concerning their age
and positions held with VSE. There were no family relationships among
any of our executive officers. For executive officers who have been
with us less than five years, their principal occupations and business
experience over the last five years are provided. The executive
officers are appointed annually to serve until the first meeting of VSE’s Board
of Directors (the “Board”) following the next annual meeting of stockholders and
until their successors are elected and have qualified, or until death,
resignation or removal, whichever is sooner.
|
Name
|
Age
|
Position with Registrant
|
|
Tina
B. Bailey
|
51
|
Vice
President – Human Resources
|
|
Thomas
G. Dacus
|
64
|
Executive
Vice President and President, Federal Group
|
|
Maurice
A. Gauthier
|
62
|
Director,
Chief Executive Officer, President and Chief Operating
Officer
|
|
|
||
|
Michael
E. Hamerly
|
64
|
Executive
Vice President and President, International Group
|
|
Randy
W. Hollstein
|
53
|
Vice
President – Marketing
|
|
William
J. Jonas
|
57
|
Vice
President - Procurement
|
|
Thomas
M. Kiernan
|
42
|
Vice
President, General Counsel and Secretary
|
|
James
W. Lexo, Jr.
|
61
|
Executive
Vice President, Strategic Planning and Business Initiatives and Vice
Chairman of the Board of Directors, ICRC
|
|
Thomas
R. Loftus
|
54
|
Executive
Vice President and Chief Financial Officer
|
|
|
||
|
James
E. Reed
|
61
|
President,
IT, Energy and Management Consulting Group
|
|
Carl
E. Williams
|
57
|
President,
Infrastructure Group
|
|
Crystal
R. Williams
|
46
|
Vice
President – Contracts
|
Mr.
Gauthier joined VSE in April 2008 as Chief Executive Officer,
President and Chief Operating Officer. He was elected as a VSE director by the
Board in February, 2009. Mr. Gauthier completed a distinguished military career
of over 28 years of service, retiring in 1997 as a Navy Captain and board
certified Department of Defense Major Program Manager. Mr. Gauthier
worked for VSE from October 1997 through February 1999 as Vice President and
Chief Technology Officer, and as Director of Strategic Planning and Business
Development, before joining the Nichols Research Corporation Navy Group as its
President. With the acquisition of Nichols Research Corporation by Computer
Sciences Corporation (“CSC”) in 1999, Mr. Gauthier served as Vice President of
CSC’s Advanced Marine Center. His most recent assignment with CSC was as Vice
President and General Manager of CSC’s Navy and Marine Corps Business Unit where
he was responsible for the overall leadership and financial performance of a
2,500-person organization providing systems engineering, technical, information
technology and telecommunications support to U.S. Navy and Marine Corps
customers. Mr. Gauthier earned a Bachelor of Science degree from the U.S. Naval
Academy. He received a Master of Science degree in Systems Engineering from the
U.S. Naval Postgraduate School, Monterey, CA. He is a graduate of the Defense
Acquisition University’s Defense Systems Management College and of the Advanced
Executive Program and the International Marketing Program
offered by the Kellogg Graduate School of Management at Northwestern
University.
13
In
December 2009, Ms. Bailey was promoted to Vice President of Human Resources,
after joining VSE as Assistant Vice President, Director of Human Resources for
the Federal Group in October 2008. Prior to joining VSE, Ms. Bailey served as
Vice President of Administration, Human Resources Director, at Science
Applications International Corporation (“SAIC”). Ms. Bailey has over 20 years of
experience as a human resources professional serving in a variety of
increasingly responsible roles at several Fortune 500 companies, including Aetna
Casualty and Surety Company, Travelers Group and Citigroup. Ms. Bailey joined
SAIC in 1998 as a Senior Level Employee Relations Manager. Ms. Bailey earned a
Bachelor of Arts degree from Virginia Commonwealth University and a Master of
Arts degree in Human Resources Management from Marymount
University.
Mr.
Hollstein joined VSE in August 2008 as Vice President of Marketing. Mr.
Hollstein has over 30 years of experience as a naval officer and defense
industry professional. Mr. Hollstein served in the U.S. Navy as a surface
warfare officer before leaving to join industry. He has worked in several
leading companies at increasing levels of responsibility in program management,
government relations and business development. Before joining VSE, Mr. Hollstein
was Senior Director of Business Development for Maersk Line, Limited where he
was responsible for business development activities related to maritime and
maritime security opportunities. In prior assignments at other companies, he has
been responsible for business development with Navy, Marine Corps, Coast Guard
and Army clients and for developing new business with other government agencies.
Mr. Hollstein earned his Bachelor of Science degree in Business Management from
Babson College.
Mr. Jonas
joined VSE in March of 2009 as Vice President of Procurement. Prior to
joining VSE, Mr. Jonas served as co-founder and President of Comprehensive
Contracting Services (“CCS”), which provides Program Management services to U.S.
Government customers in the Intelligence community. Prior to CCS, Mr.
Jonas was Vice President, General Manager of the Health and Logistics division
of IMC. Mr. Jonas has also served as Vice President of Procurement with
IAP Corporation and with Kellogg, Brown and Root, where he was responsible for
the support of government support contracts. He has held positions of
responsibility with Raytheon Company as well as TRW Space and Electronics (now
Northrop Grumman Corp.) where he spent 23 years in increasingly responsible
roles. Mr. Jonas earned a Juris Doctorate degree from Loyola Law
School in Los Angeles and a Bachelor of Science degree in Business
Administration from the University of Redlands.
Mr.
Kiernan joined VSE in November 2008 as Vice President, General Counsel, and
Assistant Secretary. From 2003 to 2008, Mr. Kiernan served as Vice President,
General Counsel and Secretary for Intelsat General Corporation, a subsidiary of
Intelsat, Ltd. serving government and commercial customers. From 2000 to 2003,
Mr. Kiernan served as a member of the Intelsat, Ltd., Office of General Counsel.
From 1994 to 2000, Mr. Kiernan served as corporate counsel for SRA Life
Sciences. Mr. Kiernan is a graduate of Virginia Tech University (B.A., Political
Science) and George Mason University School of Law. He is a member of the
Virginia State Bar.
Mr. Lexo
joined VSE in 2007 as Executive Vice President of Strategic Planning and
Business Initiatives and Vice Chairman of the Board of Directors of VSE’s wholly
owned subsidiary ICRC. Mr. Lexo was the founder of ICRC and served as
chief executive officer until its acquisition by VSE. Before his
career in business, he served on Capitol Hill as the Administrative Aide to
Congressman Don Young of Alaska for 12 years. Mr. Lexo received a
Bachelor of Arts Degree in Political Science from Westminster College in
Pennsylvania, and participated in graduate studies in government contracting at
the University of Virginia.
Mr. Reed
joined VSE in 2005 as Chief Operating Officer of VSE’s wholly owned subsidiary
Energetics, and since April 2005, he has served as Energetics’ President. Mr.
Reed was a founder of Energetics in 1979 and served as an
officer of Energetics from 1979 to 2001. He provided consulting services to
government and private clients as a sole proprietor during the period 2001
through 2004. Mr. Reed is a Registered Professional Engineer in Maryland. He was
appointed President of VSE’s IT, Energy and Management Consulting Group in
2008. Mr. Reed received a Bachelor of Science Degree in Engineering
Science from Pennsylvania State University and received a Master of Science
Degree in Electrical Science and Applied Physics from Case Western Reserve
University in Ohio.
14
Mr. Carl
Williams joined VSE in 2007 as President and Chief Operating Officer of ICRC.
Mr. Williams completed 23 years of service in the U.S. Navy, retiring as
Commander. He joined ICRC as its Executive Vice President of Operations in 2000
and has served as Chief Operating Officer of ICRC since 2003. Mr. Williams was
appointed President of VSE’s Infrastructure Group in 2008. Mr.
Williams received a Bachelor of Science Degree in Mechanical Engineering from
North Carolina State University.
Ms.
Crystal Williams joined VSE in December 2008 as Vice President –
Contracts. Prior to joining VSE, Ms. Williams was Contracts Director for the
North American Public Sector at CSC. She began her CSC career in 1994.
Prior to joining CSC, Ms. Williams provided contract administration services at
ICF Kaiser International and at Dynamic Concepts Inc. Ms. Williams is a graduate
of George Mason University (B.S., Public Administration) and has earned
continuing education credits in contracts and marketing at the American Graduate
University and at George Mason University, Continuing Education.
15
PART
II
ITEM
5. Market for Registrant’s Common Equity, Related Stockholder
Mattersand Issuer Purchases of Equity
Securities
|
(a)
|
Market
Information
|
VSE
common stock, par value $0.05 per share, is traded on the Nasdaq Global Select
Market, trading symbol, "VSEC," Newspaper listing, "VSE."
The
following table sets forth the range of high and low sales price (based on
information reported by the Nasdaq Global Select Market) and cash dividend per
share information for our common stock for each quarter and annually during the
last two years.
|
Quarter Ended
|
High
|
Low
|
Dividends
|
|||||||||
|
2008:
|
||||||||||||
|
March
31
|
$ | 49.69 | $ | 22.72 | $ | 0.040 | ||||||
|
June
30
|
35.46 | 27.50 | 0.045 | |||||||||
|
September
30
|
43.00 | 24.86 | 0.045 | |||||||||
|
December
31
|
40.32 | 23.00 | 0.045 | |||||||||
|
For the Year
|
$ | 49.69 | $ | 22.72 | $ | 0.175 | ||||||
|
2009:
|
||||||||||||
|
March
31
|
$ | 48.44 | $ | 19.51 | $ | 0.045 | ||||||
|
June
30
|
31.50 | 23.42 | 0.050 | |||||||||
|
September
30
|
41.52 | 24.53 | 0.050 | |||||||||
|
December
31
|
49.00 | 37.00 | 0.050 | |||||||||
|
For
the Year
|
$ | 49.00 | $ | 19.51 | $ | 0.195 | ||||||
(b)Holders
As of
February 6, 2010, VSE common stock, par value $0.05 per share, was held by
approximately 281 stockholders of record. The number of stockholders
of record is not representative of the number of beneficial holders because many
of the shares are held by depositories, brokers or nominees.
(c)Dividends
In 2008
cash dividends were declared quarterly at the annual rate of $0.16 per share
through March 31, 2008, and at the annual rate of $0.18 per share commencing
June 3, 2008.
In 2009
cash dividends were declared quarterly at the annual rate of $0.18 per share
through March 31, 2009, and at the annual rate of $0.20 per share commencing
June 2, 2009.
Pursuant
to our bank loan agreement (see Note 7 of "Notes to Consolidated Financial
Statements" in Item 8 of this Form 10-K), the payment of cash dividends is
subject to annual rate restrictions. We have paid cash dividends each year since
1973.
16
|
(d)
|
Equity
Compensation Plan Information
|
Compensation
Plans
We have
two compensation plans approved by our stockholders under which our equity
securities are authorized for issuance to employees and
directors: (i) the VSE Corporation 2004 Non-employee Directors Stock
Plan and (ii) the VSE Corporation 2006 Restricted Stock Plan.
In
December 2005, the Board directed VSE to discontinue, until the Board determined
otherwise, awarding options, both discretionary and nondiscretionary, to
purchase VSE’s common stock, under the 2004 Plan. The options
outstanding under the 2004 Plan and predecessor 1998 Stock Option Plan were not
affected by this Board action.
The
following table provides information about our equity compensation plans as of
December 31, 2009:
|
Plan Category
|
Number
of Shares to be Issued upon Exercise of Outstanding Options
(a)
|
Weighted
Average Exercise Price of Outstanding Options
(b)
|
Number
of Shares Remaining Available for Future Issuance Under Equity
Compensation Plans (excluding shares reflected in
column(a))(1)(2)
(c)
|
||
|
Equity
compensation plans approved by stockholders
|
-
|
$
-
|
197,487
|
||
|
Equity
compensation plan not approved by stockholders
|
-
|
$ -
|
4,373
|
||
|
Total
|
-
|
$ -
|
201,860
|
(1) At
December 31, 2009, 197,487 shares of VSE common stock were available under the
2006 Restricted Stock Plan.
(2) Includes
the remaining 4,373 shares of the 5,831 shares of VSE common stock, with
subsequent vesting and issuance dates, awarded to Maurice A. Gauthier on April
28, 2008, as an inducement to Mr. Gauthier entering into an employment agreement
with VSE to become VSE’s Chief Executive Officer and President. Such issuance of
common stock was approved by a majority of VSE’s independent
directors. Subject to the term of Mr. Gauthier’s Employment Agreement
not having terminated, the Employment Agreement provides for vesting and
issuance dates for the 5,831 shares as follows: 25% of the shares were vested
and issued to Mr. Gauthier on April 28, 2009, 25% of the shares will vest and be
issued to Mr. Gauthier on April 28, 2010 and 50% of the shares will vest and be
issued to Mr. Gauthier on April 28, 2011.
17
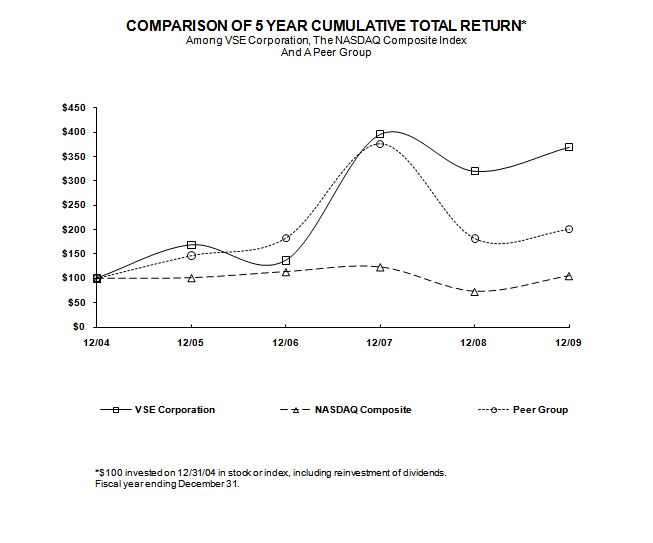
Performance
Graph
Set forth
below is a line graph comparing the cumulative total return of VSE common stock
with (a) a performance index for the broad market (NASDAQ Global Select
Market) in which VSE common stock is traded and (b) a published industry
index. VSE common stock is traded on the NASDAQ Global Select Market, and our
industry group is engineering and technical services (formerly SIC Code 8711).
Accordingly, the performance graph compares the cumulative total return for VSE
common stock with (a) an index for the NASDAQ Global Select Market (U.S.
companies) (“NASDAQ Index”) and (b) a published industry index for SIC Code
8711 (“Industry Index”).
|
|
Performance
Graph Table
|
2004
|
2005
|
2006
|
2007
|
2008
|
2009
|
|
|
VSE
|
100
|
168
|
237
|
396
|
320
|
369
|
|
NASDAQ
Composite
|
100
|
101
|
114
|
124
|
73
|
106
|
|
Peer
Group
|
100
|
147
|
183
|
376
|
182
|
200
|
18
ITEM
6. Selected Financial Data
(In
thousands, except per share data)
|
Years
ended December 31,
|
||||||||||||||||||||
|
2009
|
2008
|
2007
|
2006
|
2005
|
||||||||||||||||
|
Revenues
|
$ | 1,014,639 | $ | 1,043,735 | $ | 653,164 | $ | 363,734 | $ | 280,139 | ||||||||||
|
Net
income
|
$ | 24,024 | $ | 19,040 | $ | 14,102 | $ | 7,789 | $ | 6,169 | ||||||||||
|
Basic
earnings per share
|
$ | 4.68 | $ | 3.75 | $ | 2.85 | $ | 1.64 | $ | 1.33 | ||||||||||
|
Diluted
earnings per share
|
$ | 4.67 | $ | 3.74 | $ | 2.82 | $ | 1.61 | $ | 1.29 | ||||||||||
|
Cash
dividends per common share
|
$ | 0.195 | $ | 0.175 | $ | 0.155 | $ | 0.14 | $ | 0.12 | ||||||||||
|
As
of December 31,
|
||||||||||||||||||||
|
2009
|
2008
|
2007
|
2006
|
2005
|
||||||||||||||||
|
Working
capital
|
$ | 45,902 | $ | 24,179 | $ | 24,756 | $ | 25,646 | $ | 22,028 | ||||||||||
|
Total
assets
|
$ | 253,990 | $ | 275,966 | $ | 171,771 | $ | 98,535 | $ | 73,833 | ||||||||||
|
Stockholders'
equity
|
$ | 101,310 | $ | 76,123 | $ | 56,376 | $ | 38,236 | $ | 30,151 | ||||||||||
This
consolidated summary of selected financial data should be read in conjunction
with Management’s Discussion and Analysis of the Financial Condition and Results
of Operations included in Item 7 of this Form 10-K and with the Consolidated
Financial Statements and related Notes included in Item 8 of this Form 10-K. The
historical results set forth in this Item 6 are not necessarily indicative of
the results of operations to be expected in the future.
19
ITEM
7. Management’s Discussion and Analysis of Financial
Condition
and
Results of Operations
Executive
Overview
Organization
Our
business is focused on providing sustainment services for DoD legacy systems and
equipment and professional services to DoD and Federal Civilian agencies. VSE
operations consist primarily of diversified logistics, engineering, IT,
construction management and consulting services performed on a contract
basis. Substantially all of our contracts are with government
agencies and other government prime contractors.
Our
business operations are managed under groups that perform our services. Our
Federal Group operations are conducted by our Communications and Engineering
Division ("CED"), Engineering and Logistics Division ("ELD"), Field Support
Services Division (“FSS”), and Systems Engineering Division ("SED"). Our
International Group operations are conducted by our GLOBAL Division ("GLOBAL",
formerly our BAV Division), and Fleet Maintenance Division ("FMD"). Our IT,
Energy and Management Consulting Group operations are conducted by our wholly
owned subsidiaries Energetics Incorporated ("Energetics") and G&B Solutions,
Inc. (“G&B”). Our Infrastructure Group operations are conducted by our
wholly owned subsidiary Integrated Concepts and Research Corporation (“ICRC”).
Our Management Sciences Division ("MSD") formerly conducted operations in our
Federal Group, but is currently inactive. Our Coast Guard Division ("VCG")
formerly conducted operations in our International Group, but is currently
inactive.
Customers
and Services
We provide logistics, engineering,
legacy equipment sustainment, IT, construction management and consulting
services to the government, other government prime contractors, and commercial
entities. Our largest customer is the DoD, including agencies of the U.S. Army,
Navy and Air Force. We also provide services to civilian government customers.
See Item 1 “Business – Contracts” on page 6 for revenues by
customer.
Segments
Our
operations are conducted within four reportable segments aligned with our
management groups: 1) Federal; 2) International; 3) IT, Energy and Management
Consulting; and 4) Infrastructure.
Federal
Group - Our Federal Group provides engineering, technical, management and
integrated logistics support services to U.S. military branches and other
government agencies. The divisions in this group include CED, ELD, FSS, MSD and
SED. MSD’s service offerings have been transferred to our G&B operations and
MSD is currently inactive.
CED - CED is dedicated to
supporting the Army’s Communications and Electronics Command (“CECOM”) in the
management and execution of the Rapid Response (“R2”) Program. The R2 Program
supports clients across DoD and the government. CED manages execution of tasks
involving research and development, technology insertion, systems integration
and engineering, hardware/software fabrication and installation, testing and
evaluation, studies and analysis, technical data management, logistics support,
training and acquisition support. A large portion of our current work on this
program is related to the U.S. military involvement in Iraq and Afghanistan. A
substantial portion of our revenues on the R2 contract result from the pass
through of subcontractor support services that have a low profit
margin. The contract supporting the R2 Program is scheduled to expire
in January 2011.
CED Army
Equipment Support Program - Our CED division had a program on its R2
support contract to provide maintenance and logistics services in support of
U.S. Army equipment in Iraq and Afghanistan. We performed work on this
program for a full year in 2008, but only two months in 2009 because the program
expired in February 2009.
20
CED Assured
Mobility Systems Program - Our CED division has a program on its R2
support contract to provide technical support services in support of U.S. Army
PM Assured Mobility Systems and U.S. Army Tank-automotive and Armaments Command
(“TACOM”). In January 2009, we were awarded a $389 million follow-on task order
on this program for work that will run through January 2011.
RCV Modernization
Program – We received a task order on our R2 support contract for a
program to provide maintenance work on U.S. Army Route Clearance Vehicles in
Kuwait (the “RCV Modernization Program”)
in September 2008. We expect the initial phase of this program to run for two
years under this task order with contractual coverage of approximately $235
million.
ELD - ELD provides full life
cycle engineering, logistics, maintenance and refurbishment services to extend
and enhance the life of existing equipment. ELD principally supports the U.S.
Army, Army Reserve and Army National Guard with core competencies in combat and
combat service support system conversions, technical research, sustainment and
re-engineering, system integration and configuration management.
FSS - FSS provides worldwide
field maintenance and logistics support services for a wide variety of military
vehicles and equipment, including performance of organizational, intermediate
and specialized depot-level maintenance. FSS principally supports the U.S. Army
and Marine Corps by providing specialized Field Service Representatives (“FSR”)
and Field Support Teams (“FST”) in areas of combat operations and austere
environments.
SED - SED provides
comprehensive systems and software engineering, logistics, and prototyping
services to DoD. Our services offered through SED principally support U.S. Army,
Air Force, and Marine Corps combat and combat support systems. SED’s core
competencies include: systems technical support, configuration management and
life cycle support for wheeled and tracked vehicles and ground support
equipment; obsolescence management, service life extension, and technology
insertion programs; and technical documentation and data packages.
International
Group – Our International Group provides engineering, industrial,
logistics and foreign military sales services to the U.S. military and other
government agencies. The divisions in this Group include GLOBAL, FMD and VCG.
VCG became inactive in 2009.
GLOBAL - Through GLOBAL, we
provide assistance to the U.S. Navy in executing its Foreign Military Sales
(“FMS”) Program for surface ships sold, leased or granted to foreign countries.
Global provides program management, engineering, technical support, logistics
services for ship reactivations and transfers and follow-on technical support.
The level of revenues and associated profits resulting from fee income generated
by this program varies depending on several factors, including the timing of
ship transfers and associated support services ordered by foreign governments
and economic conditions of potential customers worldwide. Changes in the level
of activity associated with the Navy’s ship transfer program have historically
caused quarterly and annual revenue fluctuations.
FMD - FMD provides field
engineering, logistics, maintenance, and information technology services to the
U.S. Navy and Air Force, including fleet-wide ship and aircraft support
programs. FMD’s expertise includes ship repair and modernization, ship systems
installations, ordnance engineering and logistics, facility operations, war
reserve materials management, aircraft sustainment and maintenance automation
and IT systems integration.
Treasury Seized
Asset Program – FMD also provides management, maintenance, storage and
disposal support for the U.S. Department of Treasury’s seized and forfeited
general property program. Our contract with the Department of Treasury to
support this program is a cost plus incentive
21
fee
contract that contains certain conditions under which the incentive fee revenue
is earned. The amount of incentive fee earned depends on our costs incurred on
the contract compared to certain target cost levels specified in the contract.
An assessment of actual costs compared to target costs is made once annually
pursuant to the contract. We recognize incentive fee revenue when the amount is
fixed or determinable and collectability is reasonably assured. Due to the
conditions under which the incentive fee for this contract is awarded, and to
the potential for changes in the cost targets as work requirements vary, the
full amount of incentive fee for the work we perform in any one period may not
be fixed or determinable and the collectability may not be reasonably assured
until a subsequent period.
We
concluded negotiations with our customer that finalized target cost levels for
the fiscal year ending September 30, 2009 to reflect more closely the work
requirements for the year and amended certain other terms. With the conclusion
of these negotiations, our incentive fee became fixed and determinable and
collectability was reasonably assured. This allowed us to recognize
incentive fees in the third quarter of 2009 on all of our work performed during
the government’s fiscal year ended September 30, 2009. We recognized pretax
income on this program in the third quarter of 2009 of approximately $3.3
million, primarily due to this incentive fee recognition.
Contract Field
Teams Program –Our FMD division has one of several prime contracts to
support the U.S. Air Force Contract Field Teams (“CFT”) Program. Under the
program, we are providing rapid deployment and long-term support services for a
variety of Air Force requirements to maintain, repair and modernize equipment
and systems. The contract provides us with the opportunity to compete for and
expand our work performed for the Air Force.
IT,
Energy and Management Consulting Group - Our IT, Energy and Management
Consulting Group provides technical and consulting services primarily to various
civilian government agencies. This group includes Energetics and, as of April
2008, G&B.
Energetics - Energetics
provides technical, policy, business, and management support in areas of clean
and efficient energy, climate change mitigation, infrastructure protection,
measurement technology, and global health. Energetics’ expertise lies
in managing collaborative processes for diverse stakeholders in decision making,
R&D program planning and evaluation metrics, state-of-the-art technology
assessments, technical and economic feasibility analysis, and technical
communications. Customers include the U.S. Department of Energy, the
U.S. Department of Homeland Security, U.S. Department of Commerce, and other
government agencies and commercial clients.
G&B - G&B is an
established information technology provider to many government agencies,
including the Departments of Homeland Security, Interior, Labor, Agriculture,
Housing and Urban Development, and Defense; the Social Security Administration;
the Pension Benefit Guaranty Corporation; and the National Institutes of Health.
G&B’s core expertise lies in enterprise architecture development,
information assurance/business continuity, program and portfolio management,
network IT services, systems design and integration, quality assurance services
and product and process improvement services.
Infrastructure
Group – This
group consists of our ICRC subsidiary, which is engaged principally in providing
engineering and transportation infrastructure services.
Port of Anchorage
Intermodal Expansion Project (“PIEP”) - A significant amount of
ICRC's revenues and income comes from services performed on the Port of
Anchorage Intermodal Expansion Project in Alaska (the "PIEP") under a contract
with the U.S. Department of Transportation Maritime Administration (“POA
Project”). This contract requires ICRC to provide program management services,
including project management, procurement, permitting, design, and construction
to the government to expand the size of the port's facilities to accommodate
larger ships, more dock space, improved cargo flow, improved traffic flow at the
port, more environmentally friendly port operations and other modernization
enhancements. The PIEP contract has an estimated ceiling amount of
$704 million, a three-year base period of performance, and four one-year option
periods. Some of the infrastructure improvements under the PIEP typically cannot
be performed during the winter months due to subarctic conditions. The seasonal
nature of this work will cause fluctuations in our revenues on this contract,
with revenue levels typically higher in summer months and lower in winter
months. In addition, during 2009, revenues and profits were significantly
reduced on the POA Project due to temporary work schedule delays caused by
environmental, technical and weather issues near the site on which ICRC conducts
its PIEP work. We expect revenue levels on the POA Project to recover
because most of the work that were unable to perform in 2009 will be performed
in future years.
22
|
Concentration
of Revenues
|
||||||||||||||||||||||||
|
(in
thousands)
|
||||||||||||||||||||||||
|
Years
ended December 31,
|
||||||||||||||||||||||||
|
Source of Revenues
|
2009
|
%
|
2008
|
%
|
2007
|
%
|
||||||||||||||||||
|
CED
Army Equipment Support
|
$ | 55,381 | 5.4 | $ | 319,933 | 30.7 | $ | 218,615 | 33.5 | |||||||||||||||
|
CED
Assured Mobility Systems
|
144,375 | 14.2 | 92,669 | 8.9 | 27,547 | 4.2 | ||||||||||||||||||
|
RCV
Modernization (including FSS and SED labor support)
|
82,734 | 8.2 | 3,565 | 0.3 | - | - | ||||||||||||||||||
|
CED
Other
|
175,048 | 17.3 | 172,153 | 16.5 | 47,482 | 7.3 | ||||||||||||||||||
|
Total
CED
|
457,538 | 45.1 | 588,320 | 56.4 | 293,644 | 45.0 | ||||||||||||||||||
|
GLOBAL
Egypt
|
55,317 | 5.5 | 49,926 | 4.8 | 51,295 | 7.9 | ||||||||||||||||||
|
GLOBAL
Romania
|
20,136 | 1.9 | 9,737 | 0.9 | 3,682 | 0.6 | ||||||||||||||||||
|
GLOBAL
India
|
- | 0.0 | 55 | 0.0 | 38,337 | 5.9 | ||||||||||||||||||
|
GLOBAL
Other
|
30,011 | 3.0 | 22,013 | 2.1 | 20,410 | 3.1 | ||||||||||||||||||
|
Total
GLOBAL
|
105,464 | 10.4 | 81,731 | 7.8 | 113,724 | 17.5 | ||||||||||||||||||
|
Treasury
Seized Asset Program
|
45,090 | 4.4 | 55,218 | 5.3 | 53,690 | 8.2 | ||||||||||||||||||
|
POA
Project
|
35,699 | 3.5 | 89,722 | 8.6 | 30,674 | 4.7 | ||||||||||||||||||
|
Other
|
370,848 | 36.6 | 228,744 | 21.9 | 161,432 | 24.6 | ||||||||||||||||||
|
Total
Revenues
|
$ | 1,014,639 | 100.0 | $ | 1,043,735 | 100.0 | $ | 653,164 | 100.0 | |||||||||||||||
Management
Outlook
We have
made a strategic commitment to increase our direct labor revenue and diversify
our service offerings and customer base to improve our profit margins.
Concurrently, we will continue to pursue large DoD contracts for which we have
demonstrated proven expertise as those opportunities arise.
We have
significantly increased our workforce in 2008 and 2009 and we expect to achieve
further increases in future years.
|
Employee Count
|
% Increase
|
|
|
As
of December 31, 2007
|
1,223
|
|
|
Increase
in 2008
|
+ 697
|
|
|
As
of December 31, 2008
|
1,920
|
+
57%
|
|
Increase
in 2009
|
+ 614
|
|
|
As
of December 31, 2009
|
2,534
|
+
32%
|
The
majority of our new employees are engaged in work on DoD legacy systems
sustainment services, an area on which we believe DoD will continue to be
focused in the near future. Concurrently, requirements for work performed by our
subcontractors that generated much of our revenue growth in years prior to 2009
have declined. As a result, an increasing amount of our work is performed by our
employees and we are relying less on subcontractors. Revenue from work performed
by our employees, or direct labor revenue, typically has a higher profit margin
than revenue generated by our subcontractors, which generally has little or no
associated profit. While the decline in subcontractors is expected to result in
flatter overall revenue growth in the near term, we expect to benefit from
improved profit margins associated with our employee growth, enhanced control of
our client relationships, and reduced dependence upon subcontractor
priorities.
23
We are
augmenting our core base of DoD work by emphasizing growth in our non-DoD
services. These efforts have included: 1) an emphasis on marketing our
Energetics subsidiary services that has shown favorable results, including some
recent contract awards that will be performed during the next three to five
years; 2) the increase in our G&B subsidiary employees and revenues during
2009; 3) an emphasis on marketing our ICRC subsidiary infrastructure services to
a wider range of clients; and 4) our continued commitment to grow through
strategic acquisitions of companies that perform work outside the DoD market. We
expect these efforts directed toward the growth of our work in the Federal
Civilian marketplace to contribute to overall future revenue growth and
financial performance.
We also
know there are risks and uncertainties related to our business. We recognize
that 2009 was a government transition year and government spending priorities
may continue to change significantly. There are indications of a shift in
government spending to more energy, IT-related infrastructure, health care IT,
and DoD legacy systems sustainment services. We believe that our current
capabilities have us well positioned to pursue these opportunities.
The
government transition has also affected the timing of contract awards and the
funding process. The federal technical services industry experienced an
extraordinary delay in contract awards during the first year of the new
administration as it ensured these transactions were consistent with its
priorities. We anticipate that this delay in contract awards will
continue into the first half of 2010. Additionally, the government
workforce has continued to experience a loss of qualified contracting personnel
in recent years. While the government is seeking to replace this personnel loss,
we believe that this transition in the government workforce may impact proposal
decisions and delay funding of new and ongoing contract efforts. The impact of
the government’s transition and workforce issues is reflected in the summary of
funding activity presented below.
Bookings
and Funded Backlog
Revenues
in government contracting businesses are dependent upon contract funding
(“Bookings”) and funded contract backlog is an indicator of potential future
revenues. A summary of our bookings and revenues for the years ended December
31, 2009, 2008 and 2007, and funded contract backlog as of December 31, 2009,
2008 and 2007 is as follows.
|
(in
millions)
|
||||||||||||
|
2009
|
2008
|
2007
|
||||||||||
|
Bookings
|
$ | 939 | $ | 1,189 | $ | 736 | ||||||
|
Revenues
|
$ | 1,015 | $ | 1,044 | $ | 653 | ||||||
|
Funded
Backlog
|
$ | 476 | $ | 567 | $ | 408 | ||||||
Rapid
Response Program
In
January 2009, the U.S. Army informed us that it would not consider our proposal
for a new contract, known as Rapid Response – Third Generation (“R2-3G”) to
succeed our current R2 Program contract. Partially due to protest efforts by us
and other offerors, the Army subsequently amended the solicitation to allow
additional prime contract awards. We were eligible for these
additional awards and submitted a proposal that is currently under
evaluation.
24
In
addition, we have been transferring work that had previously been performed
through our R2 contract to our other omnibus contracts. We are continuing this
effort by seeking new task order awards on our other omnibus contracts for this
work as the R2 task orders expire. The award of a prime contract under the R2-3G
program would provide us with an additional, but not essential, contract on
which to place existing work and potential new work. We expect to continue our
work on existing task orders under our current R2 contract through the scheduled
contract expiration in January 2011. CED revenues are expected to decrease as
the R2 contract nears completion due to the expiration of individual task
orders. While the CED division had program work set to expire in February 2009,
it was awarded new work in January 2009. It is difficult to assess the
financial impact regarding the final outcome of the R2-3G program and our level
of participation, given uncertain DoD work requirements and our potential to
perform work under other multiple award omnibus contracts. A substantial portion
of our revenues on the R2 contract are from low profit margin subcontract work.
We believe our efforts in replacing subcontract work with direct labor are
resulting in increases in our profit margins.
Other
Programs and Contracts
In
addition to a significant new source of work in 2009 and 2010, the RCV
Maintenance Program gives us a key presence in Kuwait and could potentially
provide us with additional work in the future. Our FSS division is performing
the work on the RCV Maintenance Program and the presence of the FSS workforce
and the facility it occupies in Kuwait could attract additional similar
work.
Our ELD
division has expanded its workforce, facilities, capacity to provide services,
contractual coverage and funding since its inception, resulting in further
increases in revenues from these services in 2009. ELD revenues are primarily
generated from direct labor. Our investment in facilities and personnel to
support this work enhances our ability to serve DoD’s growing need for our
equipment refurbishment and sustainment services. Our ELD division currently has
several bids pending for additional new work that if awarded, would be expected
to increase significantly the number of our employees and revenues. Recently
released DoD budget exhibits reflect a significant plan for continuing this type
of work for several years to come.
Our SED
division was awarded a subcontract in 2009 to provide Vehicle Integration Kits
(“VIKs”), spare VIK components, and engineering and installation support on
tactical wheeled vehicles and combat vehicles for the U.S. Army and U.S. Marine
Corps through a multiple award indefinite delivery/indefinite quantity contract
under the Driver’s Vision Enhancer-Family of Systems (“DVE-FOS”) program. The
subcontract has an anticipated ceiling value of approximately $190 million
over a five-year period. We have pursued this work for several years and we
believe that this award will rekindle the growth of revenues and profits in our
SED division after its completion in 2008 of a four-year, $96 million program to
provide a protection system, the Tanker Ballistic Protection System (“TBPS”),
for vehicles deployed by the U.S. Army in Iraq.
Our
GLOBAL division revenues have increased in 2009 compared to the prior year.
Also, we expect further increases in our ship transfer revenues in the near term
based on indications from new requests for FMS assets, congressional approval of
certain ship transfers, and our receipt of a $249 million contract option
modification award in November 2009 from the U.S. Navy to provide for an
additional 12 months of continued support. This may include some of our current
client countries and some new client countries.
The CFT
Program contract gives us the opportunity to increase our sustainment and legacy
services performed for the Air Force. This program is contributing to direct
labor revenue increases in our FMD division. Our FMD division also recently
entered into a software license and services agreement that will enable us to
expand our logistics support services for air, sea and land military assets.
25
The U. S.
Department of Treasury has extended our Treasury Seized Asset Program work
through September 30, 2010. Due to larger than anticipated levels of work on
this contract and the complexity in administering performance incentives under
the contract, we agreed with our customer to discontinue additional award terms
to allow the customer to re-compete the contract under a more appropriate
contract type for work to be performed after September 30, 2010.
Our
G&B subsidiary received two major awards in 2009. One award is a subcontract
to provide systems operations support services to the Social Security
Administration. While future revenues from this award cannot be determined with
certainty, the engagement has a ceiling value of $100 million over five years.
G&B also received a $26 million prime contract award with a base period of
one year and four one-year option periods from the Army Armament Research,
Development and Engineering Center to provide enterprise excellence services.
Our
Energetics subsidiary was awarded one of the largest contracts in its history in
2009 by the U.S. Department of Energy’s Office of Electricity Delivery and
Energy Reliability. Energetics expects to receive up to $11.3 million to provide
services under a three-year subcontract.
Our ICRC
subsidiary’s work on the POA Project in Anchorage, Alaska has been a challenge
in 2009. Revenues and profits were down significantly on this project in 2009
due to temporary work schedule delays caused by
environmental, technical and weather issues near the site on which
ICRC conducts its PIEP work. We expect revenue levels on this job to recover
because most of the work we were unable to perform in 2009 will be performed in
2010 and future years.
We were
awarded a GSA Logistics Worldwide (“LOGWORLD”) contract in 2009. This new
contract is available to all government agencies and represents potential
revenues of approximately $50 million for the five-year base period, with
options to extend the period of performance for up to 10 additional years.
We have
several GSA work schedules and multiyear, multiple award, indefinite delivery,
indefinite quantity (“omnibus”) contracts that have large nominal ceiling
amounts. These contracts include the Field and Installation Readiness Support
Team (“FIRST”) contract with the U.S. Army, the SeaPort Enhanced contract with
the U.S. Navy, and the U.S. Army PEO CS & CSS Omnibus III contract. We are
one of several awardees on each contract. While our future revenues from these
GSA work schedules and omnibus contracts cannot be predicted with certainty,
they, along with our CFT Program contract, allow us to pursue task order awards
for new work.
In
summary, we believe that we are well positioned to meet the challenges of
sustaining and improving the revenue and profit levels we have achieved in
recent years. This confidence is supported by 1) the expansion of our equipment
refurbishment and sustainment services performed by ELD and the ship transfer
services performed by GLOBAL; 2) our new work on the RCV Maintenance and CFT
Programs; 3) our position as a prime contractor on our FIRST contract that
presents us with some significant bidding opportunities and award prospects; 4)
our growing level of work in the Federal Civil marketplace; 5) our increased
marketing efforts in both our DoD and Federal Civilian markets; and 6) our
continued commitment to grow through strategic acquisitions.
Recent Accounting
Pronouncements
In June
2009, the Financial Accounting Standards Board (“FASB”) issued Accounting
Standards Update No. 2009-01, “Generally Accepted Accounting Principles” (“ASC
Topic 105”), which establishes the Accounting Standards Codification (the
“Codification” or “ASC”) as the single source of
authoritative
nongovernmental U.S. GAAP, effective July 1, 2009. The Codification
supersedes existing FASB, American Institute of Certified Public Accountants
(“AICPA”), Emerging Issues Task Force (“EITF”), and related
literature. The Codification establishes one level of authoritative
GAAP. All other literature is considered
non-authoritative. The Codification is effective for interim and
annual financial periods ending after September 15, 2009. We adopted
the Codification in the quarter ending September 30,
2009.
26
In
October 2009, the FASB revised its accounting guidance related to revenue
arrangements with multiple deliverables. The guidance relates to the
determination of when the individual deliverables included in a multiple-element
arrangement may be treated as separate units of accounting and modifies the
manner in which the transaction consideration is allocated across the individual
deliverables. Also, the guidance expands the disclosure requirements
for revenue arrangements with multiple deliverables. The guidance will be
effective for us beginning on January 1, 2011, and may be applied
retrospectively for all periods presented or prospectively to arrangements
entered into or materially modified after the adoption date. Early
adoption is permitted provided that the guidance is retroactively applied to the
beginning of the year of adoption. We are currently assessing the
potential effect the adoption of this new guidance will have, if any, on our
consolidated financial statements.
Critical Accounting
Policies
Our
consolidated financial statements are prepared in accordance with accounting
principles generally accepted in the United States, which require us to make
estimates and assumptions. We believe the following critical accounting policies
affect the more significant accounts, particularly those that involve judgments,
estimates and assumptions used in the preparation of our consolidated financial
statements.
Revenue
Recognition
Substantially
all of our services are performed for our customers on a contract basis. The
three primary types of contracts used are time and materials, cost-type, and
fixed-price. Revenues result from work performed on these contracts by our
employees and our subcontractors and from costs for materials and other work
related costs allowed under our contracts.
Revenues
for time and materials contracts are recorded on the basis of contract allowable
labor hours worked multiplied by the contract defined billing rates, plus the
direct costs and indirect cost burdens associated with materials and subcontract
work used in performance on the contract. Generally, profits on time and
materials contracts result from the difference between the cost of services
performed and the contract defined billing rates for these
services.
Revenues
on cost-type contracts are recorded as contract allowable costs are incurred and
fees earned. Our Global contract and our PIEP contract are cost plus award fee
contracts. Both of these contracts have terms that specify award fee payments
that are determined by performance and level of contract activity. Award fees
are made during the year a contract modification authorizing the award fee
payment is issued subsequent to the period in which the work is performed. We do
not recognize award fee income until the fees are certain, generally upon
contract notification confirming the award fee. Due to such timing, and to
fluctuations in the level of revenues, profits as a percentage of revenues on
these contracts will fluctuate from period to period.
Revenue
recognition methods on fixed-price contracts will vary depending on the nature
of the work and the contract terms. On design, development and production
fixed-price contracts revenues are recorded as costs are incurred, using the
percentage-of-completion method of accounting. Revenues on fixed-price service
contracts are recorded as work is performed, typically ratably over the service
period. Revenues on fixed-price contracts that require delivery
of specific items may be recorded based on a price per unit as units are
delivered.
27
Revenues
by contract type for the years ended December 31 were as follows (in
thousands):
|
Contract Type
|
2009
|
%
|
2008
|
%
|
2007
|
%
|
||||||||||||||||||
|
Time
and materials
|
$ | 761,644 | 75.1 | $ | 759,693 | 72.8 | $ | 388,564 | 59.5 | |||||||||||||||
|
Cost-type
|
209,946 | 20.7 | 247,857 | 23.7 | 220,782 | 33.8 | ||||||||||||||||||
|
Fixed-price
|
43,049 | 4.2 | 36,185 | 3.5 | 43,818 | 6.7 | ||||||||||||||||||
| $ | 1,014,639 | 100.0 | $ | 1,043,735 | 100.0 | $ | 653,164 | 100.0 | ||||||||||||||||
The
increases in time and materials revenues in 2009 and 2008 shown in the table
above is primarily attributable to revenues from the CED Army Equipment Support
Program, the CED Assured Mobility Systems Program, and other CED task orders.
Substantially all of the revenues on these programs result from the pass through
of subcontractor support services that have a low profit margin for
us.
We will
occasionally perform work at risk, which is work performed prior to the
government formalizing funding for such work. Revenue related to work performed
at risk is not recognized until it can be reliably estimated and its realization
is probable. We recognize this “risk funding” as revenue when the associated
costs are incurred or the work is performed. We are at risk of loss for any risk
funding not received. We provide for anticipated losses on contracts by a charge
to income during the period in which losses are first identified. Revenues
recognized in 2009 include approximately $841 thousand for which we had not
received formalized funding as of December 31, 2009. We believe that we are
entitled to reimbursement and will receive funding for all of this risk funding
revenue.
Long-Lived
Assets
In
assessing the recoverability of long-lived assets, we must make assumptions
regarding estimated future cash flows and other factors to determine the fair
value of the respective assets. If these estimates or their related assumptions
change in the future, we may be required to record impairment charges for these
assets not previously recorded.
Goodwill
and Intangible Assets
Goodwill
and intangible assets with indefinite lives are subject to a review for
impairment at least annually. We perform our annual impairment test as of
October 1. The annual impairment assessment requires us to estimate the fair
value of our reporting units. This estimation process involves the
use of subjective assumptions. As of December 31, 2009, we had
approximately $1.1 million of goodwill associated with our acquisition of
Energetics, approximately $7.7 million of goodwill and intangible assets with
indefinite lives associated with our acquisition of ICRC, and approximately
$13.2 million of goodwill and intangible assets with indefinite lives associated
with our acquisition of G&B. We have not recognized any reduction to the
goodwill or indefinite-lived intangibles as a result of the annual impairment
tests.
Recoverability
of Deferred Tax Assets
The
carrying value of our net deferred tax assets is based on assumptions regarding
our ability to generate sufficient future taxable income to utilize these
deferred tax assets. If the estimates and related assumptions regarding our
future taxable income change in the future, we may be required to record
valuation allowances against our deferred tax assets, resulting in additional
income tax expense.
28
Results of
Operations
|
Revenues
|
||||||||||||||||||||||||
|
(dollars
in thousands)
|
||||||||||||||||||||||||
|
Years
ended December 31,
|
||||||||||||||||||||||||
|
2009
|
%
|
2008
|
%
|
2007
|
%
|
|||||||||||||||||||
|
Federal
Group
|
||||||||||||||||||||||||
|
CED
|
$ | 440,165 | 43.4 | $ | 587,044 | 56.2 | $ | 293,644 | 45.0 | |||||||||||||||
|
SED
|
28,338 | 2.8 | 26,520 | 2.5 | 36,854 | 5.6 | ||||||||||||||||||
|
ELD
|
79,256 | 7.8 | 43,954 | 4.2 | 26,158 | 4.0 | ||||||||||||||||||
|
FSS
|
38,079 | 3.7 | 7,999 | 0.8 | 1,335 | 0.2 | ||||||||||||||||||
|
MSD
|
113 | 0.0 | 1,890 | 0.2 | 2,700 | 0.4 | ||||||||||||||||||
|
Group
Total
|
585,951 | 57.7 | 667,407 | 63.9 | 360,691 | 55.2 | ||||||||||||||||||
|
International
Group
|
||||||||||||||||||||||||
|
GLOBAL
|
105,464 | 10.4 | 81,731 | 7.8 | 113,724 | 17.4 | ||||||||||||||||||
|
FMD
|
208,669 | 20.6 | 137,655 | 13.2 | 112,805 | 17.3 | ||||||||||||||||||
|
VCG
|
1 | 0.0 | 635 | 0.1 | 1,472 | 0.2 | ||||||||||||||||||
|
Group
Total
|
314,134 | 31.0 | 220,021 | 21.1 | 228,001 | 34.9 | ||||||||||||||||||
|
IT,
Energy and Management Consulting Group
|
||||||||||||||||||||||||
|
Energetics
|
22,482 | 2.2 | 19,161 | 1.8 | 14,522 | 2.2 | ||||||||||||||||||
|
G&B
|
51,309 | 5.1 | 30,664 | 3.0 | - | - | ||||||||||||||||||
|
Other
|
326 | - | 102 | - | - | - | ||||||||||||||||||
|
Group
Total
|
74,117 | 7.3 | 49,927 | 4.8 | 14,522 | 2.2 | ||||||||||||||||||
|
Infrastructure
Group
|
||||||||||||||||||||||||
|
ICRC
|
40,437 | 4.0 | 106,380 | 10.2 | 49,918 | 7.7 | ||||||||||||||||||
|
Other
|
- | 0.0 | - | 0.0 | 32 | 0.0 | ||||||||||||||||||
| $ | 1,014,639 | 100.0 | $ | 1,043,735 | 100.0 | $ | 653,164 | 100.0 | ||||||||||||||||
Our
revenues decreased by approximately $29 million or 3% for the year ended
December 31, 2009 as compared to the prior year. The slight decline in revenues
for this period resulted from decreases in revenues in our Federal Group of
approximately $81 million and in our Infrastructure Group of approximately $66
million; increases in revenues in our International Group of approximately $94
million; and increases in revenues in our IT, Energy, and Management Consulting
Group of approximately $24 million.
Our
revenues increased by approximately $391 million or 60% for the year ended
December 31, 2008 as compared to the prior year. The primary reason for the
increases in revenues for 2008 was additional work associated with our CED R2
Program of approximately $404 million, including increased work on the CED Army
Equipment Support Program of approximately $101 million and the CED Assured
Mobility Systems Program of approximately $65 million. Additional significant
reasons for the increase in our revenues in 2008 are: 1) ICRC is included in our
financial results for the full year in 2008 compared to a shorter period in 2007
as a result of the June 2007 acquisition, resulting in an increase in ICRC
revenues of approximately $57 million; and 2) the inclusion of revenues of
G&B from the April 14, 2008 date of acquisition through year end of
approximately $31 million.
29
|
Consolidated
Statements of Income
|
||||||||||||||||||||||||
|
(dollars
in thousands)
|
||||||||||||||||||||||||
|
Years
ended December 31,
|
||||||||||||||||||||||||
|
2009
|
%
|
2008
|
%
|
2007
|
%
|
|||||||||||||||||||
|
Revenues
|
$ | 1,014,639 | 100.0 | $ | 1,043,735 | 100.0 | $ | 653,164 | 100.0 | |||||||||||||||
|
Contract
costs
|
974,897 | 96.1 | 1,011,408 | 96.9 | 629,951 | 96.5 | ||||||||||||||||||
|
Gross
profit
|
39,742 | 3.9 | 32,327 | 3.1 | 23,213 | 3.5 | ||||||||||||||||||
|
Selling,
general and administrative expenses
|
1,263 | 0.1 | 1,193 | 0.1 | 905 | 0.1 | ||||||||||||||||||
|
Interest
income, net
|
(120 | ) | 0.0 | (115 | ) | 0.0 | (699 | ) | (0.1 | ) | ||||||||||||||
|
Income
before income taxes
|
38,599 | 3.8 | 31,249 | 3.0 | 23,007 | 3.5 | ||||||||||||||||||
|
Provision
for income taxes
|
14,575 | 1.4 | 12,209 | 1.2 | 8,905 | 1.4 | ||||||||||||||||||
|
Net
income
|
$ | 24,024 | 2.4 | $ | 19,040 | 1.8 | $ | 14,102 | 2.1 | |||||||||||||||
Our gross
profit dollars increased by approximately $7.4 million or 23% in 2009 as
compared to 2008. The increase resulted primarily from: 1) increased profits
from revenues in our Federal Group of approximately $3.2 million; 2) increased
profits from revenues in our International Group of approximately $4.3 million;
3) increased profits from revenues in our IT, Energy and Management Consulting
Group of approximately $4.2 million; and 4) decreased profits from revenues in
our Infrastructure Group of approximately $2.5 million.
Our gross
profit dollars increased by approximately $9.1 million or 39% in 2008 as
compared to 2007. The increases are primarily due to: 1) increased profits of
approximately $5 million from the growth of revenues on our R2 program contract;
2) increased profits of approximately $3 million from the inclusion of G&B
revenues beginning in April 2008; 3) increased profits of approximately $1.7
million from the inclusion of ICRC revenues in our operating results for the
full year in 2008 as compared to only a partial year in 2007.
Selling,
general and administrative expenses consist primarily of costs and expenses that
are not chargeable or reimbursable on our operating unit contracts. As a
percentage of revenues, these expenses varied little in 2009 and 2008 as
compared to the respective prior years.
We did
not have significant borrowing requirements or interest expense in 2009, 2008 or
2007. Our net interest income increased in 2009 as compared to 2008
as profits from operations and resulting cash surpluses were invested. Our net
interest income decreased in 2008 as compared to 2007 due to cash requirements
associated with our acquisition of G&B and the growth of other parts of our
business.
Provision
for Income Taxes
Our
effective tax rates were 37.8% for 2009, 39.1% for 2008, and 38.7% for 2007.
30
Federal
Group Results
The
following table shows consolidated operating results for our Federal Group (in
thousands).
|
2009
|
%
|
2008
|
%
|
2007
|
%
|
|||||||||||||||||||
|
Revenues
|
$ | 585,951 | 100.0 | $ | 667,407 | 100.0 | $ | 360,690 | 100.0 | |||||||||||||||
|
Contract
costs
|
564,628 | 96.4 | 649,149 | 97.3 | 348,794 | 96.7 | ||||||||||||||||||
|
Gross
profit
|
21,323 | 3.6 | 18,258 | 2.7 | 11,896 | 3.3 | ||||||||||||||||||
|
Selling,
general and administrative expenses
|
101 | 0.0 | 43 | 0.0 | 73 | 0.0 | ||||||||||||||||||
|
Interest
income, net
|
(89 | ) | 0.0 | (379 | ) | (0.1 | ) | (252 | ) | 0.0 | ||||||||||||||
|
Income
before income taxes
|
$ | 21,311 | 3.6 | $ | 18,594 | 2.8 | $ | 12,075 | 3.3 | |||||||||||||||
Revenues
for our Federal Group decreased approximately $81 million or 12% for the year
ended December 31, 2009, as compared to the prior year. The decrease in revenues
for 2009 was primarily attributable to a decrease in revenues on the CED Army
Equipment Support Program of approximately $265 million. The decrease in
revenues was partially offset by an increase in revenues on the RCV
Modernization Program of approximately $79 million, an increase in revenues on
the CED U.S. Army PM Assured Mobility Systems Program of approximately $52
million, and an increase in revenues of approximately $35 million from ELD’s
equipment refurbishment services.
Revenues
for our Federal Group increased by approximately $307 million or 85% for the
year ended December 31, 2008, as compared to the prior year. A substantial
portion of the increase in revenues for 2008 was attributable to an increase in
revenues of approximately $293 million associated with work on R2 Program task
orders, including an increase in revenues on the CED Army Equipment Support
Program of approximately $101 million and an increase in revenues on the CED
U.S. Army PM Assured Mobility Systems Program of approximately $65 million.
Revenue increases of approximately $18 million from ELD’s equipment
refurbishment services also contributed to the revenue increases in this segment
in 2008.
Gross
profits for our Federal Group increased by approximately $3.1 million or 17% for
the year ended December 31, 2009 as compared to the prior year. The increase in
gross profits is primarily due to an increase in profits on our ELD equipment
refurbishment services of approximately $8.4 million resulting from the increase
in ELD revenues and an improvement in the profit margins, and an increase in
profits of approximately $2.1 million on the RCV Modernization Program. These
increases helped to replace a decrease in profits of approximately $4.7 million
due to the completion of the TBPS program in 2008 and the resulting absence of
this program from our operating results in 2009, and a decrease in profits of
approximately $3.0 million associated with the expiration of the CED Army
Equipment Support Program in February 2009. Profit margins also improved in 2009
as compared to the prior year due to an increased level of direct labor
generated revenues, primarily in ELD, and a decline in lower margin
subcontractor generated revenue in CED.
Gross
profits for our Federal Group increased by approximately $6.4 million or 53% for
the year ended December 31, 2008, as compared to the prior year. The primary
reason for the increased gross profit dollars was increased profits on R2
Program task orders of approximately $5.8 million arising from the increase in
R2 Program revenues, including increased profits of approximately $1.9 million
on the CED Army Equipment Support Program and increased profits of approximately
$700 thousand on the CED U.S. Army PM Assured Mobility Systems Program. Profits
from the inclusion of FSS services in our operating results for a full year
contributed approximately $ 1.1 million to the increase in gross profits of this
segment in 2008. These increases in profits were partially offset by a decline
in ELD profits of approximately $500 thousand resulting from losses on work
performed during the establishment of a new location in 2008.
31
Selling,
general and administrative expenses consist primarily of costs and expenses that
are not chargeable or reimbursable on our Federal Group’s contracts. As a
percentage of revenues, these expenses varied little in 2009 and 2008 as
compared to the respective prior years and have not been significant in relation
to revenues levels.
The
Federal Group realized interest income from cash invested in 2009, 2008, and
2007. During these years, we benefited from efficient cash flow cycles on
certain CED task order work.
International
Group Results
The
following table shows consolidated operating results for our International Group
(in thousands).
|
2009
|
%
|
2008
|
%
|
2007
|
%
|
|||||||||||||||||||
|
Revenues
|
$ | 314,134 | 100.0 | $ | 220,021 | 100.0 | $ | 228,002 | 100.0 | |||||||||||||||
|
Contract
costs
|
303,972 | 96.8 | 214,146 | 97.3 | 220,624 | 96.8 | ||||||||||||||||||
|
Gross
profit
|
10,162 | 3.2 | 5,875 | 2.7 | 7,378 | 3.2 | ||||||||||||||||||
|
Selling,
general and administrative expenses
|
157 | 0.0 | 46 | 0.0 | 67 | 0.0 | ||||||||||||||||||
|
Interest
expense (income)
|
436 | 0.1 | 110 | 0.1 | (124 | ) | (0.1 | ) | ||||||||||||||||
|
Income
before income taxes
|
$ | 9,569 | 3.1 | $ | 5,719 | 2.6 | $ | 7,435 | 3.3 | |||||||||||||||
Revenues
for our International Group increased approximately $94 million or 43% for the
year ended December 31, 2009, as compared to the same period for the prior year.
The increase in revenues resulted primarily from an increase of approximately
$67 million in the level of FMD services provided on engineering and technical
services task orders; an increase of approximately $24 million in the level of
GLOBAL services, including increased revenues of approximately $10 million to
provide support services to the government of Romania; and to an increase in
revenues on the CFT Program in 2009 of approximately $14 million. The revenue
increases for this period were partly offset by a decrease in revenues on the
Treasury Seized Asset Program of approximately $10 million.
Revenues
for our International Group decreased by approximately $8 million or 3.5% for
the year ended December 31, 2008, as compared to the prior year. Our GLOBAL
division had approximately $38 million of 2007 revenues from a ship transfer to
India that was completed in 2007, and there was no similar ship transfer in
2008. This resulted in lower GLOBAL revenues and was the primary reason for the
decrease in revenues for our International Group in 2008. This decrease was
partially offset by increases of approximately $23 million in the level of FMD
services provided on engineering and technical services task orders and an
increase of approximately $6.5 million in GLOBAL services provided to the
country of Taiwan.
Gross
Profits for our International Group increased by approximately $4.3 million or
73% for the year ended December 31, 2009, as compared to the prior year. The
increase is primarily due to an increase in profits of approximately $2.3
million on the Treasury Seized Asset Program resulting from an increase in
incentive fees earned associated with re-negotiated target cost levels; an
increase in profits of approximately $621 thousand from the increased level of
FMD services provided on engineering and technical services task orders; and an
increase in profits of approximately $487 thousand from the increase in revenues
on the CFT Program.
Gross
Profits for our International Group decreased by approximately $1.5 million or
20% for the year ended December 31, 2008, as compared to the prior year. The
decrease in 2008 resulted primarily from a decrease of approximately $1 million
in GLOBAL profits due to a reduction in fees earned by GLOBAL as a result of the
lower GLOBAL revenues.
32
Selling,
general and administrative expenses consist primarily of costs and expenses that
are not chargeable or reimbursable on the International Group’s contracts. As a
percentage of revenues, these expenses varied little in 2009 and 2008 as
compared to the respective prior years and have not been significant in relation
to revenues.
Our
International Group had net interest expense in 2009 and 2008 and net interest
income in 2007. Interest income and expense vary from year to year due to growth
in work performed and to normal fluctuations in the billing and collections
cycle.
IT,
Energy and Management Consulting Group Results
The
following table shows consolidated operating results for our IT, Energy and
Management Consulting Group (in thousands).
|
2009
|
%
|
2008
|
%
|
2007
|
%
|
|||||||||||||||||||
|
Revenues
|
$ | 74,117 | 100.0 | $ | 49,927 | 100.0 | $ | 14,522 | 100.0 | |||||||||||||||
|
Contract
costs
|
66,344 | 89.5 | 45,148 | 90.4 | 13,139 | 90.5 | ||||||||||||||||||
|
Gross
profit
|
7,773 | 10.5 | 4,779 | 9.6 | 1,383 | 9.5 | ||||||||||||||||||
|
Selling,
general and administrative expenses
|
406 | 0.5 | 375 | 0.8 | 41 | 0.3 | ||||||||||||||||||
|
Interest
income, net
|
(35 | ) | 0.0 | (198 | ) | (0.4 | ) | (272 | ) | (1.9 | ) | |||||||||||||
|
Income
before income taxes
|
$ | 7,402 | 10.0 | $ | 4,602 | 9.2 | $ | 1,614 | 11.1 | |||||||||||||||
Upon our
acquisition of G&B in April 2008, G&B became part of this segment.
G&B revenues and profits are included in this segment for 12 months in 2009
and 8½ months in 2008. G&B revenues and profits are not included in 2007.
The inclusion of G&B’s revenues and profits in this segment for different
lengths of time in each year is the primary reason for significant increases to
the segment’s revenues and profits in 2009 and 2008.
Revenues
for our IT, Energy and Management Consulting Group increased by approximately
$24 million for the year ended December 31, 2009, as compared to the prior year.
Gross profits for this segment increased by approximately $3.0 million for the
year ended December 31, 2009, as compared to the prior year. Approximately $14
million of the revenue increase and $1.4 million of the profit increase is
attributable to the inclusion of G&B’s results in this segment for a full
year in 2009 as compared to 8½ months in 2008. Approximately $7 million of the
revenue increase and $1.2 million of the profit increase is attributable to
additional contract awards for G&B and increases in G&B’s employee
workforce in 2009. Increases in Energetics’ revenues of approximately $3 million
and Energetics profits of approximately $481 thousand also contributed to the
increases in this segment in 2009.
Revenues
for this segment increased by approximately $35 million for the year ended
December 31, 2008, as compared to the prior year. Gross profits for this segment
increased by approximately $3.4 million for the year ended December 31, 2008, as
compared to the prior year. Approximately $31 million of the revenue increase
and $3 million of the profit increase is attributable to the inclusion of
G&B’s results in this segment beginning in 2008. Increases in Energetics’
revenues of approximately $4.6 million and Energetics profits of approximately
$646 thousand also contributed to the increases in this segment in
2009.
Selling,
general and administrative expenses consist primarily of costs and expenses that
are not chargeable or reimbursable on our contracts. The increase in these costs
for this segment in 2008 is due to the inclusion of G&B’s results in this
segment.
Interest
income for our IT, Energy and Management Consulting Group decreased in 2009 and
2008 as compared to the respective prior years as cash surpluses were used to
finance the increases in revenues.
33
Infrastructure
Group
The
following table shows consolidated operating results for the Infrastructure
Group (in thousands).
|
2009
|
%
|
2008
|
%
|
2007
|
%
|
|||||||||||||||||||
|
Revenues
|
$ | 40,437 | 100.0 | $ | 106,380 | 100.0 | $ | 49,918 | 100.0 | |||||||||||||||
|
Contract
costs
|
39,313 | 97.2 | 102,131 | 96.0 | 46,844 | 93.8 | ||||||||||||||||||
|
Gross
profit
|
1,124 | 2.8 | 4,249 | 4.0 | 3,074 | 6.2 | ||||||||||||||||||
|
Selling,
general and administrative expenses
|
148 | 0.4 | 154 | 0.1 | 310 | 0.6 | ||||||||||||||||||
|
Interest
income, net
|
(14 | ) | 0.0 | (72 | ) | 0.0 | (44 | ) | 0.0 | |||||||||||||||
|
Income
before income taxes
|
$ | 990 | 2.4 | $ | 4,167 | 3.9 | $ | 2,808 | 5.6 | |||||||||||||||
This
segment consists of our ICRC subsidiary that we acquired in June of 2007.
Revenues decreased by approximately $66 million or 62% for the year ended
December 31, 2009, as compared to the prior year. Gross profits for this
segment decreased by approximately $3.1 million or 74% for the year ended
December 31, 2009, as compared to the prior year.
Certain
environmental, technical and weather issues near the site on which ICRC conducts
its POA Project work have caused temporary work schedule delays in 2009. These
delays have had a negative impact on 2009 revenues and profits, with revenues
from the PIEP work decreasing by approximately $54 million and profits from the
POA Project decreasing by approximately $2.8 million. The environmental and
technical issues are not caused by the work conducted by ICRC, but ICRC must
comply with recent changes and delays from environmental restrictions, recent
endangered species declarations and delays due to new permit application
requirements, recent permit conditions that slow the field work to best mitigate
environmental impacts, and the study, review, and approval of certain technical
issues by the client prior to moving planned work forward. We have also seen
delays in contract actions on proposals pending evaluation by the government.
We have
transferred certain work previously performed by ICRC to our other groups to
better align the work or the customers served with our longer term corporate
level strategies. Specifically, information technology services work has been
transferred to our IT, Energy and Management Consulting Group and certain U. S.
Army vehicle work has been transferred to our Federal Group. The decreases in
our Infrastructure Group’s revenues and profits in 2009 that are not
attributable to the decrease in PIEP work are primarily the result of
transferring work to our other groups.
Revenues
increased by approximately $56 million or 113% for the year ended December 31,
2008, as compared to the prior year. Gross profits for this segment
increased by approximately $1.2 million or 38% for the year ended December 31,
2008, as compared to the prior year. The increases in revenues and profits in
2008 are primarily due to the inclusion of ICRC in our operating results for a
full year in 2008 as compared to approximately seven months in
2007.
Financial
Condition
Our
financial condition did not change materially during 2009. Changes to asset and
liability accounts were due primarily to our earnings, our level of business
activity, contract delivery schedules, subcontractor and vendor payments
required to perform our work, and the timing of associated billings to and
collections from our customers.
34
Liquidity and Capital
Resources
Cash
Flows
Cash and
cash equivalents increased by approximately $7.4 million during
2009.
Cash
provided by operating activities increased by approximately $1.5 million in 2009
as compared to 2008. An increase of approximately $5 million in cash provided by
net income and an increase of approximately $1.4 million from an increase in
depreciation and amortization and other non-cash operating activities was offset
by a decrease of approximately $1.5 million for the acquisition of a software
license and a decrease of approximately $3.4 million due to changes in the
levels of working capital components. Of these working capital components, our
largest asset is our accounts receivable and our largest liability is our
accounts payable. A significant portion of our accounts receivable and accounts
payable result from the use of subcontractors to perform work on our contracts
and from the purchase of materials to fulfill our contract requirements.
Accordingly, our levels of accounts receivable and accounts payable may
fluctuate significantly depending on the timing of government services ordered,
the timing of billings received from subcontractors and materials vendors to
fulfill these services, and the timing of payments received from government
customers in payment of these services. Such timing differences have the
potential to cause significant increases and decreases in our accounts
receivable and accounts payable in short time periods.
Cash used
in our investing activities in 2009 decreased by approximately $18.5 million as
compared to 2008. This was primarily due to the acquisition of G&B for which
we expended cash at closing of approximately $17.1 million in 2008.
Cash of
approximately $6.7 million was used for financing activities in 2009 as compared
to cash provided by financing activities of approximately $6.4 million for the
same period of 2008. This difference was primarily due to paying down borrowings
on our bank loan in 2009 as compared to 2008 when we borrowed to finance our
acquisition of G&B.
Our cash
and cash equivalents increased by approximately $529 thousand during
2008.
Cash
provided by operating activities in 2008 increased by approximately $14.7
million in 2008 as compared to 2007. Approximately $4.9 million of this increase
was due to the increase in net income, approximately $6.4 million was due to an
increase in depreciation and amortization and other non-cash operating
activities and approximately $3.4 million was due to changes in
the levels of working capital components such as receivables,
contract inventories, accounts payable, and accrued expenses that are associated
with our contract requirements and billing and collections cycle. As described
above, these working capital components tend to fluctuate significantly
depending on the timing of government services ordered, which has the potential
to cause significant increases and decreases in these working capital
components.
Cash used
in our investing activities in 2008 increased by approximately $8.3 million as
compared to 2007. This was due primarily to the higher cost of acquiring G&B
in 2008 for approximately $17.1 million compared to the cost of acquiring ICRC
in 2007 for approximately $11.6 million, additional payments associated with the
cost of acquiring ICRC made in 2008, and to an increased level of investment in
property and equipment.
Cash
provided by our financing activities in 2008 increased by a net amount of
approximately $2.8 million as compared to 2007. This resulted from an increase
of approximately $6.6 million in net bank borrowings and a decrease of
approximately $3.6 in cash provided by activity associated with our stock
incentive plans.
35
We paid
quarterly cash dividends totaling $0.19 per share during 2009. Pursuant to our
bank loan agreement, our payment of cash dividends is subject to annual
restrictions. We have paid cash dividends each year since 1973.
Liquidity
Our
internal sources of liquidity are primarily from operating activities,
specifically from changes in the level of revenues and associated accounts
receivable and accounts payable, and from profitability. Significant increases
or decreases in revenues and accounts receivable and accounts payable can cause
significant increases or decreases in internal liquidity. Our accounts
receivable and accounts payable levels can be affected by changes in the level
of the work we perform and by the timing of large materials purchases and
subcontractor efforts used in our contracts.
We also
purchase property and equipment and invest in expansion, improvement, and
maintenance of our operational and administrative facilities. From time to time,
we may also invest in the acquisition of other companies. Our acquisitions of
ICRC in 2007 and G&B in 2008 required a significant use of our cash. While
there are no pending specific additional acquisitions at this time, we continue
to seek opportunities for growth through strategic acquisitions.
Our
external liquidity consists of a loan agreement with a group of banks that
provides us with revolving loans and letters of credit. The maximum amount of
credit available to us as of December 31, 2009 was $50 million and under the
loan agreement we may elect to increase the maximum credit availability up to
$75 million. The maturity date of the loan agreement is August 26, 2011.
The amount of credit available to us under the loan agreement is subject to
certain conditions, including a borrowing formula based on our billed
receivables. Under the terms of the loan agreement, we may borrow against the
revolving loan at any time and can repay the borrowings at any time without
premium or penalty. We pay a commitment fee, interest on any revolving loan
borrowings at a prime-based rate or an optional LIBOR-based rate, and fees on
any letters of credit that are issued.
We were
using approximately $4.8 million of the loan agreement availability as of
December 31, 2009, consisting of letters of credit. We had no revolving loan
amounts outstanding as of December 31, 2009. During 2009, the highest
outstanding amount was $23.4 million and the lowest was $0. The timing of
certain payments made and collections received associated with our subcontractor
and materials requirements and other operating expenses can cause temporary
peaks in our outstanding revolving loan amounts.
The loan
agreement contains collateral requirements that secure our assets, restrictive
covenants, a limit on annual dividends, and other affirmative and negative
covenants. Restrictive covenants include a maximum Leverage Ratio (Total Funded
Debt/EBITDA) and a minimum Fixed Charge Coverage Ratio that we were in
compliance with at December 31, 2009.
|
Maximum Ratio
|
Actual Ratio
|
|
|
Leverage
Ratio
|
3.00
to 1
|
0.11
to 1
|
|
Minimum Ratio
|
Actual Ratio
|
|
|
Fixed
Charge Coverage Ratio
|
1.25
to 1
|
2.93
to 1
|
Our banks
continue to maintain investment grade credit ratings from the ratings services
and we believe that we are well positioned to obtain financing from other banks
if the need should arise. Accordingly, we do not believe that turbulence in the
financial markets will have a material adverse impact on our ability to finance
our business, financial condition, or results of operations. We currently do not
use public debt security financing.
36
Contractual
Obligations
The
following table shows our consolidated contractual obligations as of December
31, 2009 (in thousands):
|
Payments Due by Period
|
||||||||||||||||||||
|
Less
than
|
1-3 | 4-5 |
After
5
|
|||||||||||||||||
|
Contractual
Obligations
|
Total
|
1 year
|
years
|
years
|
years
|
|||||||||||||||
|
Operating
leases, net of non-cancelable sublease income
|
$ | 106,283 | $ | 10,170 | $ | 18,568 | $ | 17,923 | $ | 59,622 | ||||||||||
|
Purchase
obligations
|
1,168 | 1,168 | - | - | - | |||||||||||||||
|
Total
|
$ | 107,451 | $ | 11,338 | $ | 18,568 | $ | 17,923 | $ | 59,622 | ||||||||||
Operating
lease commitments are primarily for our principal executive and administrative
offices and leased facilities for office, shop, and warehouse space located near
customer sites or to serve customer needs, including the new 15-year lease
agreement we signed during 2009, for the new executive and administrative
headquarters beginning in the spring of 2012. We also have some equipment and
software leases that are included in these amounts.
Purchase
obligations consist primarily of contractual commitments associated with our
information technology systems. The table excludes contractual commitments for
materials or subcontractor work purchased to perform U.S. Government contracts.
Such commitments for materials and subcontractors are reimbursable when used on
the contracts, and generally are also reimbursable if a contract is “terminated
for convenience” by the government pursuant to federal contracting regulations.
Inflation and
Pricing
Most of
our contracts provide for estimates of future labor costs to be escalated for
any option periods, while the non-labor costs in our contracts are normally
considered reimbursable at cost. Our property and equipment consists principally
of computer systems equipment, furniture and fixtures, shop equipment, and land
and improvements. We do not expect the overall impact of inflation on
replacement costs of our property and equipment to be material to our future
results of operations or financial condition.
ITEM
7A. Quantitative and Qualitative Disclosures About Market
Risks
Interest
Rates
Our bank
loan provides available borrowing to us at variable interest rates. The amount
borrowed is not large with respect to our cash flows and we believe that we will
be able to pay down any bank loan borrowings in a relatively short time frame.
Because of this, we do not believe that any adverse movement in interest rates
would have a material impact on future earnings or cash flows. If we were to
significantly increase our borrowings, future interest rate changes could
potentially have a material impact on us.
37
ITEM
8. Financial Statements and Supplementary
Data
|
Index
To Financial Statements
|
|
|
Page
|
|
|
Report
of Independent Registered Public Accounting Firm
|
39
|
|
Consolidated
Balance Sheets as of December 31, 2009 and 2008
|
40
|
|
Consolidated
Statements of Income for the years ended
December
31, 2009, 2008, and 2007
|
41
|
|
Consolidated
Statements of Stockholders' Equity
for
the years ended December 31, 2009, 2008, and 2007
|
42
|
|
Consolidated
Statements of Cash Flows for the years ended
December
31, 2009, 2008, and 2007
|
43
|
|
Notes
to Consolidated Financial Statements
|
44
|
38
Report
of Independent Registered Public Accounting Firm
The
Board of Directors and Stockholders of VSE Corporation
We have
audited the accompanying consolidated balance sheets of VSE Corporation and
subsidiaries as of December 31, 2009 and 2008, and the related consolidated
statements of income, stockholders' equity, and cash flows for each of the three
years in the period ended December 31, 2009. These financial
statements are the responsibility of the Company's management. Our
responsibility is to express an opinion on these financial statements based on
our audits.
We
conducted our audits in accordance with the standards of the Public Company
Accounting Oversight Board (United States). Those standards require that we plan
and perform the audit to obtain reasonable assurance about whether the financial
statements are free of material misstatement. An audit includes examining, on a
test basis, evidence supporting the amounts and disclosures in the financial
statements. An audit also includes assessing the accounting principles used and
significant estimates made by management, as well as evaluating the overall
financial statement presentation. We believe that our audits provide a
reasonable basis for our opinion.
In our
opinion, the financial statements referred to above present fairly, in all
material respects, the consolidated financial position of VSE Corporation and
subsidiaries at December 31, 2009 and 2008, and the consolidated results of
their operations and their cash flows for each of the three years in the period
ended December 31, 2009, in conformity with U.S. generally accepted accounting
principles.
We also
have audited, in accordance with the standards of the Public Company Accounting
Oversight Board (United States), VSE Corporation's internal control over
financial reporting as of December 31, 2009, based on criteria established in
Internal Control-Integrated Framework issued by the Committee of Sponsoring
Organizations of the Treadway Commission and our report dated March 4, 2010
expressed an unqualified opinion thereon.
/s/ Ernst & Young LLP
McLean,
VA
March 4,
2010
39
VSE
Corporation and Subsidiaries
Consolidated
Balance
Sheets
(in
thousands, except share and per share amounts)
|
As
of December 31,
|
||||||||
|
2009
|
2008
|
|||||||
|
Assets
|
||||||||
|
Current
assets:
|
||||||||
|
Cash
and cash equivalents
|
$ | 8,024 | $ | 638 | ||||
|
Receivables,
principally U.S. Government, net
|
175,185 | 206,717 | ||||||
|
Deferred
tax assets
|
2,036 | 2,297 | ||||||
|
Other
current assets
|
7,979 | 10,945 | ||||||
|
Total
current assets
|
193,224 | 220,597 | ||||||
|
|
||||||||
|
Property
and equipment, net
|
24,683 | 21,484 | ||||||
|
Intangible
assets
|
9,336 | 11,176 | ||||||
|
Goodwill
|
19,530 | 17,439 | ||||||
|
Other
assets
|
7,217 | 5,270 | ||||||
|
Total
assets
|
$ | 253,990 | $ | 275,966 | ||||
|
|
||||||||
|
Liabilities
and Stockholders’ Equity
|
||||||||
|
Current
liabilities:
|
||||||||
|
Accounts
payable
|
$ | 112,995 | $ | 158,015 | ||||
|
Bank
notes payable
|
- | 6,676 | ||||||
|
Accrued
expenses
|
34,069 | 31,498 | ||||||
|
Dividends
payable
|
258 | 229 | ||||||
|
Total
current liabilities
|
147,322 | 196,418 | ||||||
|
|
||||||||
|
Deferred
compensation
|
3,934 | 2,059 | ||||||
|
Deferred
income taxes
|
324 | 404 | ||||||
|
Other
liabilities
|
1,100 | 962 | ||||||
|
Total
liabilities
|
152,680 | 199,843 | ||||||
|
|
||||||||
|
Commitments
and contingencies
|
||||||||
|
|
||||||||
|
Stockholders’
equity:
|
||||||||
|
Common
stock, par value $0.05 per share, authorized 15,000,000 shares; issued and
outstanding 5,170,180 and 5,098,542, respectively
|
258 | 255 | ||||||
|
Additional
paid-in capital
|
15,720 | 13,557 | ||||||
|
Retained
earnings
|
85,332 | 62,311 | ||||||
|
Total
stockholders’ equity
|
101,310 | 76,123 | ||||||
|
Total
liabilities and stockholders’ equity
|
$ | 253,990 | $ | 275,966 | ||||
The
accompanying notes are an integral part of these balance
sheets.
40
VSE
Corporation and Subsidiaries
Consolidated
Statements of
Income
(in
thousands, except share and per share amounts)
|
For
the years ended December 31,
|
||||||||||||
|
2009
|
2008
|
2007
|
||||||||||
|
Revenues
|
$ | 1,014,639 | $ | 1,043,735 | $ | 653,164 | ||||||
|
Contract
costs
|
974,897 | 1,011,408 | 629,951 | |||||||||
|
Gross
profit
|
39,742 | 32,327 | 23,213 | |||||||||
|
Selling,
general and administrative expenses
|
1,263 | 1,193 | 905 | |||||||||
|
Interest
income, net
|
(120 | ) | (115 | ) | (699 | ) | ||||||
|
Income
before income taxes
|
38,599 | 31,249 | 23,007 | |||||||||
|
Provision
for income taxes
|
14,575 | 12,209 | 8,905 | |||||||||
|
Net
income
|
$ | 24,024 | $ | 19,040 | $ | 14,102 | ||||||
|
Basic
earnings per share:
|
$ | 4.68 | $ | 3.75 | $ | 2.85 | ||||||
|
Basic
weighted average shares outstanding
|
5,128,344 | 5,072,131 | 4,953,289 | |||||||||
|
Diluted
earnings per share:
|
$ | 4.67 | $ | 3.74 | $ | 2.82 | ||||||
|
Diluted
weighted average shares outstanding
|
5,146,347 | 5,096,186 | 5,003,675 | |||||||||
The
accompanying notes are an integral part of these financial
statements.
41
VSE
Corporation and Subsidiaries
Consolidated
Statements of Stockholders’ Equity
(in thousands except per share
data)
|
Additional
|
Total
|
|||||||||||||||||||
|
Common
Stock
|
Paid-In
|
Retained
|
Stockholders’
|
|||||||||||||||||
|
Shares
|
Amount
|
Capital
|
Earnings
|
Equity
|
||||||||||||||||
|
Balance
at
|
||||||||||||||||||||
|
December
31, 2006
|
4,788 | $ | 240 | $ | 7,163 | $ | 30,833 | $ | 38.236 | |||||||||||
|
Net
income for the year
|
- | - | - | 14,102 | 14,102 | |||||||||||||||
|
Stock-based
compensation
|
5 | - | 551 | - | 551 | |||||||||||||||
|
Exercised
stock options
|
260 | 13 | 2,004 | - | 2,017 | |||||||||||||||
|
Excess
tax benefits from share-based
payment arrangements
|
- | - | 2,245 | - | 2,245 | |||||||||||||||
|
Dividends
declared ($0.155)
|
- | - | - | (775 | ) | (775 | ) | |||||||||||||
|
Balance
at
|
||||||||||||||||||||
|
December
31, 2007
|
5,053 | 253 | 11,963 | 44,160 | 56,376 | |||||||||||||||
|
Net
income for the year
|
- | - | - | 19,040 | 19,040 | |||||||||||||||
|
Stock-based
compensation (1)
|
14 | 1 | 955 | - | 956 | |||||||||||||||
|
Exercised
stock options
|
32 | 1 | 324 | - | 325 | |||||||||||||||
|
Excess
tax benefits from share-based
payment arrangements
|
- | - | 315 | - | 315 | |||||||||||||||
|
Dividends
declared ($0.175)
|
- | - | - | (889 | ) | (889 | ) | |||||||||||||
|
Balance
at
|
||||||||||||||||||||
|
December
31, 2008
|
5,099 | 255 | 13,557 | 62,311 | 76,123 | |||||||||||||||
|
Net
income for the year
|
- | - | - | 24,024 | 24,024 | |||||||||||||||
|
Stock-based
compensation (2)
|
32 | 1 | 1,234 | - | 1,235 | |||||||||||||||
|
Exercised
stock options
|
39 | 2 | 432 | - | 434 | |||||||||||||||
|
Excess
tax benefits from share-based
payment arrangements
|
- | - | 497 | - | 497 | |||||||||||||||
|
Dividends
declared ($0.195)
|
- | - | - | (1,003 | ) | (1,003 | ) | |||||||||||||
|
Balance
at
|
||||||||||||||||||||
|
December
31, 2009
|
5,170 | $ | 258 | $ | 15,720 | $ | 85,332 | $ | 101,310 | |||||||||||
(1) The
stock-based compensation amount of $956 for 2008 is based on
the compensation expense included in Contract costs of approximately
$1,062, reduced by the tax withholding associated with the 2007 awards issued in
March, 2008.
(2) The
stock-based compensation amount of $1,235 for 2009 is based on the compensation
expense included in Contract costs of $1,492, reduced by the tax withholding
associated with the 2007 and 2008 awards issued in March, 2009.
The
accompanying notes are an integral part of these financial
statements.
42
VSE
Corporation and Subsidiaries
Consolidated
Statements of Cash
Flows
(in
thousands)
|
For
the years ended December 31,
|
||||||||||||
|
2009
|
2008
|
2007
|
||||||||||
|
Cash
flows from operating activities:
|
||||||||||||
|
Net
income
|
$ | 24,024 | $ | 19,040 | $ | 14,102 | ||||||
|
Adjustments
to reconcile net income to net cash
|
||||||||||||
|
provided
by operating activities:
|
||||||||||||
|
Depreciation
and amortization
|
7,622 | 5,437 | 3,463 | |||||||||
|
(Gain)
loss on sale of property and
equipment
|
(157 | ) | 10 | - | ||||||||
|
Deferred
taxes
|
558 | 1,241 | (805 | ) | ||||||||
|
Stock-based
compensation
|
1,235 | 956 | 551 | |||||||||
|
Excess
tax benefits on stock-based compensation
|
(497 | ) | (315 | ) | (2,245 | ) | ||||||
|
Changes
in operating assets and liabilities,
|
||||||||||||
|
net
of impact of acquisitions:
|
||||||||||||
|
Receivables,
net
|
31,532 | (66,928 | ) | (59,141 | ) | |||||||
|
Contract
inventories
|
- | - | 4,459 | |||||||||
|
Other
current assets and noncurrent assets
|
949 | (8,318 | ) | (1,254 | ) | |||||||
|
Accounts
payable and deferred compensation
|
(43,145 | ) | 65,513 | 41,812 | ||||||||
|
Accrued
expenses
|
2,126 | 5,868 | 7,071 | |||||||||
|
Other
liabilities
|
138 | 421 | 235 | |||||||||
|
Net
cash provided by operating activities
|
24,385 | 22,925 | 8,248 | |||||||||
|
Cash
flows from investing activities:
|
||||||||||||
|
Purchases
of property and equipment
|
(8,634 | ) | (10,016 | ) | (8,731 | ) | ||||||
|
Cash
paid for acquired businesses, net of cash acquired
|
(1,646 | ) | (18,753 | ) | (11,755 | ) | ||||||
|
Net
cash used in investing activities
|
(10,280 | ) | (28,769 | ) | (20,486 | ) | ||||||
|
Cash
flows from financing activities:
|
||||||||||||
|
Borrowings
on loan arrangement
|
204,649 | 245,864 | 9,589 | |||||||||
|
Repayments
on loan arrangement
|
(211,325 | ) | (239,269 | ) | (9,508 | ) | ||||||
|
Dividends
paid
|
(974 | ) | (862 | ) | (741 | ) | ||||||
|
Excess
tax benefits on stock-based compensation
|
497 | 315 | 2,245 | |||||||||
|
Proceeds
from the exercise of stock options
|
434 | 325 | 2,017 | |||||||||
|
Net
cash (used in) provided by financing activities
|
(6,719 | ) | 6,373 | 3,602 | ||||||||
|
Net
increase (decrease) in cash and cash
equivalents
|
7,386 | 529 | (8,636 | ) | ||||||||
|
Cash
and cash equivalents at beginning of year
|
638 | 109 | 8,745 | |||||||||
|
Cash
and cash equivalents at end of year
|
$ | 8,024 | $ | 638 | $ | 109 | ||||||
|
Supplemental
cash flow disclosures (in thousands):
|
||||||||||||
|
2009
|
2008
|
2007
|
||||||||||
|
Interest
|
$ | 119 | $ | 214 | $ | 6 | ||||||
|
Income
taxes
|
$ | 15,729 | $ | 10,919 | $ | 7,139 | ||||||
The
accompanying notes are an integral part of these financial
statements.
43
VSE
Corporation and Subsidiaries
Notes
to Consolidated Financial Statements
December
31, 2009
(1) Nature
of Business and Significant Accounting Policies
Nature
of Business
The term
“VSE,” the “Company,” “us,” “we,” or “our” means VSE and its subsidiaries and
divisions unless the context indicates operations on the parent company
only.
Our
business is focused on providing sustainment services for U.S. Department of
Defense ("DoD") legacy systems and equipment and professional services to DoD
and Federal Civilian agencies. VSE operations consist primarily of diversified
program management, logistics, engineering, equipment refurbishment, IT,
construction management and consulting services performed on a contract basis.
Substantially all of our contracts are with United States Government
(“government”) agencies and other government prime contractors.
Significant
Accounting Policies
Principles
of Consolidation
The
consolidated financial statements consist of the operations of our parent
company, our unincorporated divisions and wholly owned subsidiaries. Our active,
unincorporated divisions include GLOBAL Division (“GLOBAL”), formerly known as
“BAV Division” or “BAV,” Communications and Engineering Division (“CED”),
Engineering and Logistics Division (“ELD”), Field Support Services Division
(“FSS”), Fleet Maintenance Division (“FMD”), and Systems Engineering Division
(“SED”). Energetics Incorporated (“Energetics”), Integrated Concepts and
Research Corporation (“ICRC”), and G&B Solutions, Inc. (“G&B”), acquired
in April 2008, are our currently active subsidiaries. In 2009, our
inactive divisions include Coast Guard Division (“VCG”), and Management Sciences
Division (“MSD”). All intercompany transactions have been eliminated in
consolidation.
Subsequent
Events
There
were no subsequent events that required recognition or disclosure.
Use
of Estimates in the Preparation of Financial Statements
The
preparation of financial statements in conformity with accounting principles
generally accepted in the United States requires us to make estimates and
assumptions that affect the reported amounts of assets and liabilities and
disclosure of contingent assets and liabilities at the date of the financial
statements and the reported amounts of revenues and expenses during the
reporting period. Actual results could differ from those estimates. Significant
estimates affecting the financial statements include accruals for contract
disallowance reserves, self-insured health claims, and estimated
cost-to-complete on certain fixed-price contracts.
Stock-Based
Compensation
We
account for share-based awards in accordance with the applicable accounting
rules which require the measurement and recognition of compensation expense for
all share-based payment awards based on estimated fair values. The compensation
expense, included in operating expenses, is amortized on a straight-line basis
over the requisite service period. See Note 9 for further discussion of our
stock-based compensation plans and related activity.
44
Earnings
Per Share
Basic
earnings per share have been computed by dividing net income by the weighted
average number of shares of common stock outstanding during each period. Shares
issued during the period and shares reacquired during the period are weighted
for the portion of the period that they were outstanding. Diluted earnings per
share have been computed in a manner consistent with that of basic earnings per
share while giving effect to all potentially dilutive common shares that were
outstanding during each period. Potentially dilutive common shares
include incremental common shares issuable upon exercise of stock options. There
were no common shares issuable upon the exercise of stock options that could
potentially dilute EPS in the future that were not included in the computation
of diluted EPS because to do so would have been anti-dilutive for the years
ended December 31, 2009, 2008 and 2007.
|
Years
Ended December 31,
|
||||||||||||
|
2009
|
2008
|
2007
|
||||||||||
|
Basic
weighted average common
shares outstanding
|
5,128,344 | 5,072,131 | 4,953,289 | |||||||||
|
Effect
of dilutive options
|
18,003 | 24,055 | 50,386 | |||||||||
|
Diluted
weighted average common
shares outstanding
|
5,146,347 | 5,096,186 | 5,003,675 | |||||||||
Cash
and Cash Equivalents
We
consider all highly liquid investments with an original maturity of three months
or less to be cash equivalents. Due to the short maturity of these instruments,
the carrying values on our consolidated balance sheets approximate fair
value.
Property
and Equipment
Property
and equipment are recorded at cost. Depreciation of computer equipment and
furniture is provided principally by the straight-line method over periods of
three to nine years. Depreciation of other equipment is provided principally by
the double-declining method over periods of five to ten years. Depreciation of
buildings and land improvements is provided principally by the straight-line
method over periods of approximately twenty to thirty years. Amortization of
leasehold improvements is provided by the straight-line method over the lesser
of their useful life or the remaining term of the lease.
Concentration
of Credit Risk/Fair Value of Financial Instruments
Financial
instruments that potentially subject us to concentration of credit risk consist
primarily of cash, cash equivalents and trade receivables. Contracts
with the government either as a prime or subcontractor, accounted for
approximately 99% of revenues for each of the years ending December 31, 2009,
2008, and 2007. We believe that concentrations of credit risk with respect to
trade receivables are limited as they are primarily government receivables. We
believe that the fair market value of all financial instruments, including
assets of the deferred compensation plan and debt, approximate book
value.
Revenues
Substantially
all of our revenues result from contract services performed for the government
or for contractors engaged in work for the government under a variety of
contracts. Revenues are considered earned when persuasive evidence of an
arrangement exists, services have been rendered, the price is fixed or
determinable and collectability is reasonably assured.
45
Revenues
on cost-type contracts are recorded as contract allowable costs are incurred and
fees earned. Award fee payments on certain cost plus award fee contracts are
determined by performance and level of contract activity. We do not recognize
award fee income until the fees are fixed or determinable, generally upon
contract notification confirming the award fee.
Revenues
for time and materials contracts are recorded on the basis of contract allowable
labor hours worked multiplied by the contract defined billing rates, plus the
direct costs and indirect cost burdens associated with materials and subcontract
work used in performance on the contract. Profits on time and materials
contracts result from the difference between the cost of services performed and
the contract defined billing rates for these services.
Revenue
recognition methods on fixed-price contracts vary depending on the nature of the
work and the contract terms. On design, development and production fixed-price
contracts revenues are recorded as costs are incurred, using the
percentage-of-completion method of accounting. Revenues on fixed-price service
contracts are recorded as work is performed. Revenues on fixed-price contracts
that require delivery of specific items may be recorded based on a price per
unit as units are delivered.
For
design and development contracts, we provide for anticipated losses on
contracts, based on total revenue compared to total contract costs, by a charge
to income during the period in which losses are first identified. Contract costs
include direct and indirect costs, including general and administrative costs,
which are considered costs and expenses of contracts.
Revenue
related to work performed on contracts at risk, which is work performed at the
customer’s request prior to the government formalizing funding, is not
recognized until it can be reliably estimated and its realization is probable.
A
substantial portion of contract and administrative costs are subject to audit by
the Defense Contract Audit Agency. Our indirect cost rates have been
audited and approved for 2005 and prior years with no material adjustments to
our results of operations or financial position. While we maintain
reserves to cover the risk of potential future audit adjustments based primarily
on the results of prior audits, there can be no assurances that the audits of
the indirect cost rates for 2009, 2008, 2007 and 2006 will not result in
material adjustments to our results of operations or financial
position.
Receivables
and Allowance for Doubtful Accounts
Receivables
are recorded at face value less an allowance for doubtful
accounts. We review our receivables regularly to determine if there
are any potential uncollectible accounts. The majority of our
receivables are from agencies of the government, where there is minimal credit
risk. We record allowances for bad debt as a reduction to receivables
and an increase to bad debt expense. We assess the adequacy of these reserves by
considering general factors, such as the length of time individual receivables
are past due and historical collection experience.
Deferred
Compensation Plans
We have a
deferred compensation plan, the VSE Corporation Deferred Supplemental
Compensation Plan, to provide incentive and reward for our management team based
on overall corporate performance. Deferred compensation plan expense
for the years ended December 31, 2009, 2008, and 2007 was approximately $1.7
million, $1.4 million, and $1.1 million, respectively.
Included
in other current assets and other assets on the accompanying Consolidated
Balance Sheets are assets of the deferred compensation plans which include debt
and equity securities recorded at fair value. The fair value of the deferred
compensation plan assets was approximately $4.8 million and $3.3 million as of
December 31, 2009, and 2008, respectively. Because plan participants are at risk
for market value changes in these assets, the liability to plan participants
fluctuates with the asset values.
46
Impairment
of Long-Lived Assets
Long-lived
assets include property and equipment to be held and used. Long-lived assets are
reviewed for impairment whenever events or changes in circumstances indicate
that such a review is necessary. The criteria for determining
impairment for such long-lived assets to be held and used are determined by
comparing the carrying value of these long-lived assets to our best estimate of
future undiscounted cash flows expected to result from the use of the assets. No
impairment charges were recorded in the years ended December 31, 2009, 2008, and
2007.
Income
Taxes
Income
taxes are accounted for under the asset and liability method. Under the asset
and liability method, deferred tax assets and liabilities are recognized for the
estimated future tax consequences attributable to differences between the
financial statement carrying amounts of existing assets and liabilities and
their respective tax bases. This method also requires the recognition of future
tax benefits, such as net operating loss carryforwards, to the extent that
realization of such benefits is more likely than not. Deferred tax assets and
liabilities are measured using enacted tax rates expected to apply to taxable
income in the years in which those temporary differences are expected to be
recovered or settled. The effect on deferred tax assets and liabilities of a
change in tax rates is recognized in income in the period that includes the
enactment date.
The
carrying value of net deferred tax assets is based on assumptions regarding our
ability to generate sufficient future taxable income to utilize these deferred
tax assets.
In the
accompanying Consolidated Statements of Income, we classify interest expense
related to unrecognized tax benefits as “Interest income, net” and any penalties
in “Selling, general and administrative expenses.” No
interest or penalties related to unrecognized tax benefits were recorded in
2009, 2008 or 2007.
Goodwill
and Intangibles
Goodwill
and other indefinite-lived assets are not amortized, but are reviewed for
impairment annually, or more frequently if potential interim indicators are
identified. We test for impairment using a two-step approach at the
reporting unit level by comparing the reporting unit’s carry amount, including
goodwill, to the estimated fair value of the reporting unit. If the
carrying amount of the unit exceeds its estimated fair value, a second step is
performed to measure the amount of impairment loss, if any. Based on
the analysis we performed as of October 1, 2009, 2008 and 2007, respectively, we
found no impairment in the carrying value of goodwill.
Intangible
assets consist of the value of contract-related intangible assets and trade
names acquired in the ICRC and G&B acquisitions (see Note 6). The
contract related intangible assets are amortized on a straight line basis over
their estimated useful lives of approximately 5 to 8 years with a weighted
average life of approximately 6.2 years as of December 31, 2009.
Recently
Issued Accounting Pronouncements
In June
2009, the Financial Accounting Standards Board (“FASB”) issued Accounting
Standards Update No. 2009-01, “Generally Accepted Accounting Principles” (“ASC
Topic 105”), which establishes the Accounting Standards Codification (the
“Codification” or “ASC”) as the single source of authoritative nongovernmental
U.S. GAAP, effective July 1, 2009. The Codification supersedes
existing FASB, American Institute of Certified Public Accountants (“AICPA”),
Emerging Issues Task Force (“EITF”), and related literature. The
Codification establishes one level of authoritative GAAP. All other
literature is considered non-authoritative. The Codification is
effective for interim and annual financial periods ending after September 15,
2009. We adopted the Codification in the quarter ending September 30,
2009.
47
In
October 2009, the FASB revised its accounting guidance related to revenue
arrangements with multiple deliverables. The guidance relates to the
determination of when the individual deliverables included in a multiple-element
arrangement may be treated as separate units of accounting and modifies the
manner in which the transaction consideration is allocated across the individual
deliverables. Also, the guidance expands the disclosure requirements
for revenue arrangements with multiple deliverables. The guidance will be
effective for us beginning on January 1, 2011, and may be applied
retrospectively for all periods presented or prospectively to arrangements
entered into or materially modified after the adoption date. Early
adoption is permitted provided that the guidance is retroactively applied to the
beginning of the year of adoption. We are currently assessing the
potential effect the adoption of this new guidance will have, if any, on our
financial statements.
(2) Receivables
The
components of receivables as of December 31, 2009 and 2008, were as follows (in
thousands):
|
2009
|
2008
|
|||||||
|
Billed
|
$ | 50,410 | $ | 70,044 | ||||
|
Unbilled:
|
||||||||
|
Government
retainage
|
13 | 76 | ||||||
|
Subcontract
retainage
|
- | 3,372 | ||||||
|
Other
(principally December work billed in January
|
124,762 | 133,225 | ||||||
|
Total
receivables, net
|
$ | 175,185 | $ | 206,717 | ||||
The
“Unbilled: Other” includes certain costs for work performed at risk but which we
believe will be funded by the government. Amounts not currently
funded included in “Unbilled: Other” were approximately $841 thousand and $1.0
million as of December 31, 2009, and 2008, respectively.
The following table summarizes activity
in the allowance for doubtful accounts (in thousands):
|
Allowance for Doubtful
Accounts
|
Balance
at Beginning of Year
|
Deductions
|
Charged
to Costs and Expenses
|
Balance
at End of Year
|
||||||||||||
|
Year
ended December 31, 2009
|
$ | - | $ | 92 | $ | 92 | $ | - | ||||||||
|
Year
ended December 31, 2008
|
$ | 11 | $ | 11 | $ | - | $ | - | ||||||||
|
Year
ended December 31, 2007
|
$ | 14 | $ | 3 | $ | - | $ | 11 | ||||||||
(1)
Write-offs and settlements
48
(3) Other
Current Assets and Other Assets
At December 31, 2009 and 2008, other
current assets primarily consisted of vendor advances, prepaid rents and
deposits, prepaid income taxes, software licenses, deferred compensation plan
assets and prepaid maintenance agreements.
At December 31, 2009 and 2008, other
assets primarily consisted of deferred compensation plan assets and cash
surrender value of life insurance policies. In addition, at December
31, 2009, other assets included an acquired software license.
(4) Property
and Equipment
Property
and equipment consisted of the following as of December 31, 2009 and 2008 (in
thousands):
|
2009
|
2008
|
|||||||
|
Computer
equipment
|
$ | 14,323 | $ | 9,553 | ||||
|
Furniture,
fixtures, equipment and other
|
12,108 | 10,459 | ||||||
|
Leasehold
improvements
|
5,968 | 4,699 | ||||||
|
Buildings
and building improvements
|
6,573 | 6,564 | ||||||
|
Land
and land improvements
|
3,084 | 3,085 | ||||||
| 42,056 | 34,360 | |||||||
|
Less
accumulated depreciation and amortization
|
(17,373 | ) | (12,876 | ) | ||||
|
Total
property and equipment, net
|
$ | 24,683 | $ | 21,484 | ||||
Depreciation
and amortization expense for property and equipment for the years ended December
31, 2009, 2008 and 2007 was approximately $5.6 million, $3.6 million and $2.6
million, respectively.
(5) Acquisitions
G&B
Solutions, Inc.
On April
14, 2008, we acquired all of the capital stock of G&B. G&B’s
core expertise lies in enterprise architecture development, information
assurance/business continuity, program and portfolio management, network IT
servicers and systems design and integration. Cash paid at closing
for G&B was approximately $19.5 million, including approximately $650
thousand of prepaid retention bonuses that were expensed in the post-acquisition
period as the affected employees provided services, less approximately $600
thousand for certain closing adjustments. We also incurred
approximately $200 thousand of direct acquisition costs consisting of legal,
accounting and other fees.
Under the
terms of the acquisition, we are required to make additional payments of up to
$4.2 million over a three year post-closing period if G&B achieves certain
financial performance targets. The first earn-out payment period ended on March
31, 2009 and resulted in a $1.4 million cash payment to the seller in the second
quarter which was recorded as goodwill. The subsequent earn-out payment periods
are April 1, 2009 to March 31, 2010 and April 1, 2010 to March 31,
2011. If earned and paid, such additional purchase price
consideration will be recorded as goodwill on the consolidated balance
sheet. Additionally, $212 thousand was paid and recorded as goodwill
during the second quarter of 2009 for taxes related to the Internal Revenue Code
Section 338(h)(10) election for the G&B acquisition. The results of
G&B’s operations are included in the accompanying consolidated financial
statements beginning as of April 14, 2008.
49
Integrated
Concepts and Research Corporation
On June
4, 2007, we acquired all of the capital stock of ICRC. ICRC’s core
expertise lies in engineering and transportation infrastructure, information
technology, advance vehicle technology, aerospace, engineering and
transportation infrastructure.
Cash paid
at closing for ICRC was approximately $11.8 million. Potential additional cash
payments of up to approximately $5.8 million are contingent on meeting certain
financial targets during the first six years after the June 2007 acquisition
related to the earn-out provisions of the agreement.
Based on
ICRC’s performance for the 2008 and 2007 earn-out periods, approximately $1.6
million and $557 thousand, respectively, was paid to the seller and recorded as
goodwill. Additional goodwill of approximately $445 thousand was
recorded as of December 31, 2009 for the earn-out payment that will be made to
the seller as a result of achievement of the specified earnings target in
2009. The results of ICRC’s operations are included in the
accompanying consolidated financial statements beginning as of June 4,
2007.
(6) Goodwill
and Intangible Assets
Changes
in goodwill for the years ended December 31, 2009 and 2008 are as follows (in
thousands):
|
IT,
Energy and Management Consulting
|
Infrastructure
|
Total
|
||||||||||
|
Balance
as of December 31, 2007
|
$ | 1,054 | $ | 4,174 | $ | 5,228 | ||||||
|
Goodwill
recorded during the year
|
10,587 | - | 10,587 | |||||||||
|
Contingent
consideration earned
|
- | 1,624 | 1,624 | |||||||||
|
Balance
as of December 31, 2008
|
11,641 | 5,798 | 17,439 | |||||||||
|
Contingent
consideration earned
|
1,400 | 445 | 1,845 | |||||||||
|
Tax
payments and other
|
246 | - | 246 | |||||||||
|
Balance
as of December 31, 2009
|
$ | 13,287 | $ | 6,243 | $ | 19,530 | ||||||
Intangible
assets consist of the value of contract-related intangible assets and trade
names acquired in the ICRC and G&B acquisitions (see Note 5). Intangible
assets not subject to amortization consist of trade names of approximately $2.4
million as of December 31, 2009 and 2008. Amortization of
contract-related intangible assets was approximately $1.8 million, $1.6 million
and $600 thousand for the years ended December 31, in 2009, 2008 and 2007,
respectively.
Amortizable
intangible assets were comprised of the following (in thousands):
|
Gross
Carrying Value
|
Accumulated
Amortization
|
Net
Carrying Value
|
||||||||||
|
Contract-related
intangible assets as
of December 31, 2009
|
$ | 10,954 | $ | 4,048 | $ | 6,906 | ||||||
|
Contract-related
intangible assets as
of December 31, 2008
|
$ | 10,954 | $ | 2,208 | $ | 8,746 | ||||||
50
Future
expected amortization expense of the contract related intangible asset is as
follows for the years ending December 31, (in thousands):
|
Amortization
Expense
|
||||
|
2010
|
$ | 1,840 | ||
|
2011
|
1,840 | |||
|
2012
|
1,840 | |||
|
2013
|
708 | |||
|
2014
|
479 | |||
|
Thereafter
|
199 | |||
|
Total
|
$ | 6,906 | ||
(7) Bank
Notes Payable
We have a
loan agreement with a group of banks that provides us with revolving loans and
letters of credit. The maximum amount of credit available to us as of December
31, 2009 was $50 million and includes a provision whereby we may elect to
increase the maximum credit availability to a total of $75 million. The maturity
date of the loan agreement is August 26, 2011. From time to time we may
request changes in the amount, maturity date, or other terms and the banks may
amend the loan to accommodate our request. The amount of credit available to us
under the loan agreement is subject to certain conditions, including a borrowing
formula based on our billed receivables. Under the terms of the loan agreement,
we may borrow against the revolving loan at any time and can repay the
borrowings at any time without premium or penalty. We pay a commitment fee,
interest on any revolving loan borrowings at a prime-based rate or an optional
LIBOR-based rate, and fees on any letters of credit that are
issued.
We had
approximately $4.8 million and $1.35 million of letters of credit outstanding as
of December 31, 2009 and 2008, respectively. We had no revolving loan amounts
outstanding as of December 31, 2009. As of December 31, 2008, revolving loan
amounts outstanding were approximately $6.7 million. Interest expense incurred
on revolving loan borrowings was approximately $117 thousand for the year ended
December 31, 2009 and approximately $216 thousand for the year ended December
31, 2008.
The loan
agreement contains collateral requirements that secure our assets, restrictive
covenants, a limit on annual dividends, and other affirmative and negative
covenants. Under the terms of the loan agreement, we have agreed to maintain a
$600 thousand compensating balance with one of the banks. As of December 31,
2009 we have not been notified by the banks, nor are we aware, of any defaults
under the loan agreement. We were in compliance with the covenants at December
31, 2009.
(8) Accrued
Expenses
Accrued
expenses consisted primarily of accrued compensation and benefits of
approximately $28.9 million and $22.7 million as of December 31, 2009 and 2008,
respectively. The accrued compensation and benefits amounts include
bonus, salaries and related payroll taxes, vacation and deferred compensation.
(9)
Stock-Based Compensation Plans
(a) Restricted
Stock Plan
On January 2, 2006, our
stockholders approved the VSE Corporation 2006 Restricted Stock Plan (the “2006
Plan”) for its directors, officers and other employees. Under the
provisions of the 2006 Plan, we are authorized to issue 250,000 shares of our
common stock. The Compensation Committee is responsible for the
administration of the 2006 Plan. The Compensation Committee
determines each recipient of an award under the 2006 Plan, the number of
restricted shares of common stock subject to such award and the period of
continued employment required for the vesting of such award. These
terms will be included in award agreements between us and the recipients of the
award. As of December 31, 2009, 197,487 restricted shares were
available for grant under this plan.
51
On
January 2, 2009, we awarded 6,300 shares of restricted stock to our non-employee
directors under the 2006 Restricted Stock Plan. The grant-date fair
value of these restricted stock grants was $39.81 per share. The shares issued
vested immediately and cannot be sold, transferred, pledged or assigned before
the second anniversary of the grant date. Compensation expense related to these
grants was approximately $251 thousand during the first quarter of
2009.
On
January 2, 2008, we awarded 3,500 shares of restricted stock to our non-employee
directors under the 2006 Restricted Stock Plan. The grant-date fair
value of these restricted stock grants was $47.92 per share. The shares issued
vested immediately and could not be sold, transferred, pledged or assigned
before the second anniversary of the grant date. Compensation expense related to
these grants was approximately $168 thousand during the first quarter of
2008.
On
January 2, 2009, January 3, 2008 and January 2, 2007, we notified certain
employees that they are eligible to receive awards under the 2006 Restricted
Stock Plan based on our financial performance for the fiscal years 2009 (the
“2009 Awards”), 2008 (the “2008 Awards”), and 2007 (the “2007 Awards”),
respectively. Vesting of each award occurs one-third on the date of
award and one-third on each of the next two anniversaries of such date of award.
The date of award determination is expected to be in March 2010 for the 2009
Awards. The date of award determination for the 2008 Awards and
2007 Awards was March 3, 2009 and March 3, 2008, respectively. On each vesting
date, 100% of the vested award is paid in our shares. The
number of shares issued is based on the fair market value of our common stock on
the vesting date. The earned amount is expensed ratably over the
vesting period of approximately three years. On March 2, 2009, the employees
eligible for the 2008 Awards and 2007 Awards received 23,538 shares of common
stock. The grant-date fair value of these awards was $21.17 per
share.
On April
28, 2009, an executive received 989 shares of common stock based on the vesting
schedule of the award issued on April 22, 2008. The fair value of
this award was $34.30 per share at the time of the award.
The
stock-based compensation amount of approximately $1.2 million and approximately
$1 million shown on the accompanying statements of cash flows for the years
ended December 31, 2009 and 2008, respectively, is based on the compensation
expense included in contract costs reduced by the tax withholding associated
with the awards issued.
We have
recognized approximately $1.2 million, $700 thousand, and $278 thousand in
expense related to the awards to employees described above for the years ended
December 31, 2009, 2008 and 2007, respectively. At December 31, 2009,
there was approximately $1.5 million of unrecognized compensation costs related
to these restricted stock awards which we expect to recognize over the next 26
months.
(b) Stock
Option Plans
On
December 30, 2005, our Board of Directors (the "Board") directed us to
discontinue awarding options, both discretionary and nondiscretionary under our
1998 Stock Option Plan (the “1998 Plan”) and our 2004 Stock Option Plan approved
by our stockholders on May 3, 2005 (the "2004 Plan"). The 1998 Plan
terminated on May 6, 2008 and no options issued remain outstanding.
As of
December 31, 2009, no options issued under the 2004 Plan for VSE common stock
remain outstanding. Each option granted under the 2004 Plan was issued at the
fair market value of our common stock on the date of
grant.
52
Information
with respect to the number of shares under stock options is as follows:
|
Shares
|
Weighted
Average Exercise Price
|
|||||||
|
Outstanding
at January 1, 2008
|
73,500 | $ | 11.53 | |||||
|
Granted
|
- | - | ||||||
|
Exercised
|
(32,000 | ) | $ | 10.07 | ||||
|
Forfeited
|
- | - | ||||||
|
Terminations
|
- | - | ||||||
|
Outstanding
at January 1, 2009
|
41,500 | $ | 12.59 | |||||
|
Granted
|
- | - | ||||||
|
Exercised
|
(41,500 | ) | $ | 12.59 | ||||
|
Forfeited
|
- | - | ||||||
|
Terminations
|
- | - | ||||||
|
Outstanding
at December 31, 2009
|
- | $ | - | |||||
The total
intrinsic value of options exercised during 2009, 2008 and 2007 was
approximately $1.3 million, $819 thousand and $5.8 million,
respectively. The aggregate intrinsic value of options outstanding
and exercisable as of December 31, 2008 was approximately $1.1 million. All
options outstanding as of December 31, 2008 and December 31, 2007 were fully
vested as of December 31, 2007. The total fair value of shares vested
during the year ended December 31, 2007 was approximately $1.7 million. At
December 31, 2009, there was no unrecognized compensation cost related to
nonvested stock options.
(c)
Stock-Based Compensation Expense
Stock-based
compensation, which includes compensation recognized on stock option grants and
restricted stock awards, was included in the following line items on the
accompanying statements of income for the years ended December 31, 2009, 2008
and 2007 (in thousands):
|
2009
|
2008
|
2007
|
||||||||||
|
Contract
costs
|
$ | 1,492 | $ | 1,062 | $ | 370 | ||||||
|
Selling,
general and administrative expenses
|
- | - | 181 | |||||||||
|
Total
pre-tax stock-based compensation Included
in income before income taxes
|
1,492 | 1,062 | 551 | |||||||||
|
Income
tax benefit recognized for stock-based
compensation
|
(565 | ) | (408 | ) | (212 | ) | ||||||
|
Total
stock-based compensation expense, net
of income tax benefit
|
$ | 927 | $ | 654 | $ | 339 | ||||||
(10) Income
Taxes
We are
subject to U.S. federal income tax as well as income tax in multiple state and
local jurisdictions. We have substantially concluded all U.S. federal
income tax matters as well as material state and local tax matters for years
through 2005.
53
We file
consolidated federal income tax returns that include all of our
subsidiaries. The components of the provision for income taxes for
the years ended December 31, 2009, 2008, and 2007 are as follows (in thousands):
|
2009
|
2008
|
2007
|
||||||||||
|
Current
|
||||||||||||
|
Federal
|
$ | 12,075 | $ | 9,061 | $ | 8,326 | ||||||
|
State
|
1,942 | 1,907 | 1,384 | |||||||||
| 14,017 | 10,968 | 9,710 | ||||||||||
|
Deferred
|
||||||||||||
|
Federal
|
622 | 1,284 | (702 | ) | ||||||||
|
State
|
(64 | ) | (43 | ) | (103 | ) | ||||||
| 558 | 1,241 | (805 | ) | |||||||||
|
Provision
for income taxes
|
$ | 14,575 | $ | 12,209 | $ | 8,905 | ||||||
The
differences between the amount of tax computed at the federal statutory rate of
35% for 2009, 2008 and 2007, and the provision for income taxes for 2009, 2008,
and 2007 are as follows (in thousands):
|
2009
|
2008
|
2007
|
||||||||||
|
Tax
at statutory federal income tax
rate
|
$ | 13,509 | $ | 10,937 | $ | 8,053 | ||||||
|
Increases
(decreases) in tax resulting from:
|
||||||||||||
|
State
taxes, net of federal tax benefit
|
1,230 | 1,211 | 833 | |||||||||
|
Permanent
differences, net
|
64 | 61 | 19 | |||||||||
|
Other,
net
|
(228 | ) | - | - | ||||||||
|
Provision
for income taxes
|
$ | 14,575 | $ | 12,209 | $ | 8,905 | ||||||
Our
deferred tax assets and liabilities as of December 31, 2009 and 2008, which
represent the tax effects of temporary differences between tax and financial
accounting bases of assets and liabilities and are measured using presently
enacted tax rates, are as follows (in thousands):
|
2009
|
2008
|
|||||||
|
Current
deferred tax assets
|
$ | 3,353 | $ | 2,816 | ||||
|
Current
deferred tax liabilities
|
(1,317 | ) | (519 | ) | ||||
|
Net
current deferred tax assets
|
2,036 | 2,297 | ||||||
|
Noncurrent
deferred tax assets
|
3,147 | 2,198 | ||||||
|
Noncurrent
deferred tax liabilities
|
(3,420 | ) | (2,527 | ) | ||||
|
Valuation
allowance
|
(51 | ) | (75 | ) | ||||
|
Net
noncurrent deferred tax liabilities
|
(324 | ) | (404 | ) | ||||
|
Net
deferred tax assets
|
$ | 1,712 | $ | 1,893 | ||||
As of
December 31, 2009 and 2008, we had valuation allowances of approximately $51
thousand and $75 thousand, respectively, against certain deferred tax assets,
which consisted solely of realized capital losses on investments in our deferred
supplemental compensation plan. The valuation allowance is based on limited
unrealized capital gains within the portfolio and the uncertainty of the future
gains due to the current stock market.
We will
continue to evaluate our valuation allowance position on a regular
basis. To the extent that we determine that all or a portion of our
valuation allowance is no longer necessary, we will recognize an income tax
benefit in the period such determination is made for the reversal of the
valuation allowance.
54
The tax
effect of temporary differences representing deferred tax assets and liabilities
as of December 31, 2009 and 2008, are as follows (in thousands):
|
2009
|
2008
|
|||||||
|
Gross
deferred tax assets
|
||||||||
|
Deferred
compensation and accrued paid leave
|
$ | 4,139 | $ | 3,242 | ||||
|
Restricted
stock expense
|
430 | 280 | ||||||
|
Accrued
expenses
|
828 | 568 | ||||||
|
Reserve
for contract and other disallowances
|
231 | 204 | ||||||
|
Stock
option expense
|
- | 52 | ||||||
|
Retainage
|
3 | 3 | ||||||
|
Total
gross deferred tax assets
|
5,631 | 4,349 | ||||||
|
Less
valuation allowance
|
(51 | ) | (75 | ) | ||||
|
Net
gross deferred tax assets
|
$ | 5,580 | $ | 4,274 | ||||
|
Gross
deferred tax liabilities
|
||||||||
|
Depreciation
|
(2,561 | ) | (1,721 | ) | ||||
|
Deferred
revenues
|
(927 | ) | (417 | ) | ||||
|
Intangible
assets
|
(380 | ) | (243 | ) | ||||
|
Total
gross deferred tax liabilities
|
(3,868 | ) | (2,381 | ) | ||||
|
Net
deferred tax assets
|
$ | 1,712 | $ | 1,893 | ||||
(11) Commitments
and Contingencies
(a) Leases
and Other Commitments
We have
various non-cancelable operating leases for facilities, equipment, and software
with terms between two and fifteen years. The terms of the facilities leases
typically provide for certain minimum payments as well as increases in lease
payments based upon the operating cost of the facility and the consumer price
index. Rent expense is recognized on a straight-line basis for rent
agreements having escalating rent terms. Lease payments for the years
ended December 31, 2009, 2008, and 2007 were as follows (in
thousands):
|
Lease
Payments
|
Sublease
Income
|
Net
Expense
|
||||||||||
|
2009
|
$ | 12,546 | $ | 782 | $ | 11,764 | ||||||
|
2008
|
$ | 10,378 | $ | 709 | $ | 9,669 | ||||||
|
2007
|
$ | 7,180 | $ | 981 | $ | 6,199 | ||||||
Future
minimum annual non-cancelable commitments as of December 31, 2009 are as follows
(in thousands):
|
Lease
Commitments
|
Sublease
Income
|
Net
Commitments
|
||||||||||
|
2010
|
$ | 10,628 | $ | 459 | $ | 10,169 | ||||||
|
2011
|
9,190 | 477 | 8,713 | |||||||||
|
2012
|
10,352 | 497 | 9,855 | |||||||||
|
2013
|
9,530 | 169 | 9,361 | |||||||||
|
2014
|
8,563 | - | 8,563 | |||||||||
|
Thereafter
|
59,622 | - | 59,622 | |||||||||
|
Total
|
$ | 107,885 | $ | 1,602 | $ | 106,283 | ||||||
The
future minimum annual non-cancelable commitments above includes our 15-year
lease commitment under our agreement to lease a new building with approximately
95,000 square feet of office space that will serve as our new executive and
administrative headquarters beginning in the spring of 2012.
55
(b) Contingencies
We have,
in the normal course of business, certain claims against us and against other
parties. In our opinion, the resolution of these claims will not have
a material adverse effect on our results of operations or financial position.
However, the results of any legal proceedings cannot be predicted with
certainty.
(12) Business
Segments and Customer Information
Segment Information
Management
of our business operations is conducted under four reportable operating
segments: the Federal Group, the International Group, the IT, Energy and
Management Consulting Group, and the Infrastructure Group. These segments
operate under separate management teams and financial information is
produced for each segment. The various divisions within the Federal
Group and the International Group and the two subsidiaries within the IT, Energy
and Management Consulting Group are operating segments as defined by the
accounting standard for segment reporting and meet the aggregation of operating
segments criteria. We evaluate segment performance based on
consolidated revenues and profits or losses from operations before income
taxes.
Federal Group - The
Federal Group provides legacy equipment sustainment, engineering, technical,
management, integrated logistics support and information technology services to
all U.S. military branches and other government agencies. The Federal Group
consists of five divisions: CED, ELD, FSS, SED and MSD. MSD became
inactive in 2009.
International Group -
Our International Group provides engineering, industrial, logistics and foreign
military sales services to the U.S. military and other government agencies. It
consists of three divisions: GLOBAL, FMD and VCG. VCG became inactive
in 2009.
IT, Energy and Management
Consulting Group – The IT, Energy and Management Consulting Group
provides technical and consulting services primarily to various civilian
government agencies. This group consists of Energetics and, upon acquisition in
April 2008, G&B.
Infrastructure Group
– The Infrastructure Group is engaged principally in providing diversified
technical and management services to the government, including transportation
infrastructure services and aerospace services. This group consists
of ICRC.
56
Our
segment information is as follows (in thousands):
|
For
the years ended December 31,
|
||||||||||||
|
2009
|
2008
|
2007
|
||||||||||
|
Revenues
|
||||||||||||
|
Federal
Group
|
$ | 585,951 | $ | 667,407 | $ | 360,690 | ||||||
|
International
Group
|
314,134 | 220,021 | 228,002 | |||||||||
|
IT,
Energy and Management Consulting Group
|
74,117 | 49,927 | 14,522 | |||||||||
|
Infrastructure
Group
|
40,437 | 106,380 | 49,918 | |||||||||
|
Corporate
|
- | - | 32 | |||||||||
|
Total
revenues
|
$ | 1,014,639 | $ | 1,043,735 | $ | 653,164 | ||||||
|
Income
before income taxes:
|
||||||||||||
|
Federal
Group
|
$ | 21,311 | $ | 18,594 | $ | 12,075 | ||||||
|
International
Group
|
9,569 | 5,719 | 7,435 | |||||||||
|
IT,
Energy and Management Consulting Group
|
7,402 | 4,602 | 1,614 | |||||||||
|
Infrastructure
Group
|
990 | 4,167 | 2,808 | |||||||||
|
Corporate
|
(673 | ) | (1,833 | ) | (925 | ) | ||||||
|
Income
before income taxes
|
$ | 38,599 | $ | 31,249 | $ | 23,007 | ||||||
|
Interest
(income) expense
|
||||||||||||
|
Federal
Group
|
$ | (89 | ) | $ | (379 | ) | $ | (252 | ) | |||
|
International
Group
|
436 | 110 | (124 | ) | ||||||||
|
IT,
Energy and Management Consulting Group
|
(35 | ) | (198 | ) | (272 | ) | ||||||
|
Infrastructure
Group
|
(14 | ) | (72 | ) | (44 | ) | ||||||
|
Corporate
|
(418 | ) | 424 | (7 | ) | |||||||
|
Total
interest (income) expense
|
$ | (120 | ) | $ | (115 | ) | $ | (699 | ) | |||
|
Depreciation
and amortization expense:
|
||||||||||||
|
Federal
Group
|
$ | 4,008 | $ | 2,242 | $ | 1,514 | ||||||
|
International
Group
|
1,211 | 967 | 890 | |||||||||
|
IT,
Energy and Management Consulting Group
|
1,168 | 877 | 184 | |||||||||
|
Infrastructure
Group
|
1,235 | 1,351 | 875 | |||||||||
|
Total
depreciation and amortization
|
$ | 7,622 | $ | 5,437 | $ | 3,463 | ||||||
|
Capital
expenditures:
|
||||||||||||
|
Federal
Group
|
$ | 2,898 | $ | 5,941 | $ | 6,401 | ||||||
|
International
Group
|
427 | 1,248 | 332 | |||||||||
|
IT,
Energy and Management Consulting Group
|
268 | 419 | 75 | |||||||||
|
Infrastructure
Group
|
161 | 247 | 34 | |||||||||
|
Corporate
|
4,880 | 2,161 | 1,889 | |||||||||
|
Total
capital expenditures
|
$ | 8,634 | $ | 10,016 | $ | 8,731 | ||||||
|
As
of December 31,
|
||||||||||||
|
Total
assets:
|
||||||||||||
|
Federal
Group
|
$ | 125,040 | $ | 145,786 | $ | 74,204 | ||||||
|
International
Group
|
38,994 | 47,331 | 49,438 | |||||||||
|
IT,
Energy and Management Consulting Group
|
19,543 | 17,258 | 3,860 | |||||||||
|
Infrastructure
Group
|
9,438 | 17,933 | 14,885 | |||||||||
|
Corporate
|
60,975 | 47,658 | 29,384 | |||||||||
|
Total
assets
|
$ | 253,990 | $ | 275,966 | $ | 171,771 | ||||||
Revenues
are net of inter-segment eliminations. Corporate/unallocated expenses
are primarily selling, general and administrative expenses not allocated to
segments. Corporate assets are primarily cash and property and
equipment.
57
Customer Information
We are engaged principally in providing
engineering, design, logistics, management and technical services to the
government, other government prime contractors, and commercial entities. The
largest customer for our services is the DoD, including agencies of the U.S.
Army, Navy, and Air Force. Our revenue by customer is as follows for the years
ended December 31, (in thousands):
|
Customer
|
2009
|
%
|
2008
|
%
|
2007
|
%
|
||||||||||||||||||
|
U.S.
Army/Army Reserve
|
$ | 555,238 | 54.7 | $ | 625,237 | 59.9 | $ | 344,296 | 52.7 | |||||||||||||||
|
U.S.
Navy
|
271,189 | 26.7 | 195,792 | 18.8 | 189,534 | 29.0 | ||||||||||||||||||
|
U.S.
Air Force
|
13,839 | 1.4 | 10,720 | 1.0 | 4,628 | 0.7 | ||||||||||||||||||
|
Total
- DoD
|
840,266 | 82.8 | 831,749 | 79.7 | 538,458 | 82.4 | ||||||||||||||||||
|
Department
of U.S. Treasury
|
47,676 | 4.7 | 57,021 | 5.5 | 55,020 | 8.4 | ||||||||||||||||||
|
Department
of Transportation
|
35,722 | 3.5 | 89,873 | 8.6 | 30,977 | 4.7 | ||||||||||||||||||
|
Department
of Interior
|
29,275 | 2.9 | 19,156 | 1.8 | 1,053 | 0.2 | ||||||||||||||||||
|
Department
of Energy
|
16,111 | 1.6 | 12,812 | 1.2 | 10,537 | 1.6 | ||||||||||||||||||
|
Other
government
|
42,670 | 4.2 | 29,748 | 2.9 | 11,427 | 1.8 | ||||||||||||||||||
|
Total
– Federal Civil Agencies
|
171,454 | 16.9 | 208,610 | 20.0 | 109,014 | 16.7 | ||||||||||||||||||
|
Commercial
|
2,919 | 0.3 | 3,376 | 0.3 | 5,692 | 0.9 | ||||||||||||||||||
|
Total
|
$ | 1,014,639 | 100.0 | $ | 1,043,735 | 100.0 | $ | 653,164 | 100.0 | |||||||||||||||
We do not
measure revenue or profit by product or service lines, either for internal
management or external financial reporting purposes, because it would be
impractical to do so. Products offered and services performed are determined by
contract requirements and the types of products and services provided for one
contract bear no relation to similar products and services provided on another
contract. Products and services provided vary when new contracts begin or
current contracts expire. In many cases, more than one product or service is
provided under a contract or contract task order. Accordingly, cost and revenue
tracking is designed to best serve contract requirements and segregating costs
and revenues by product or service lines in situations for which it is not
required would be difficult and costly to both us and our
customers.
(13) Capital
Stock
Common
Stock
Our
common stock has a par value of $0.05 per share. Proceeds from the
issue of the common stock that is greater than $0.05 per share is credited to
additional paid in capital. Holders of common stock are entitled to
one vote per common share held on all matters voted on by our
stockholders. Stockholders of record are entitled to the amount of
dividends declared per common share held.
58
(14) ESOP/401(k)
Plan and Profit Sharing Plan
We have
an ESOP/401(k), the VSE Corporation ESOP/401(k) Plan (the “Plan”), that allows
employees meeting certain age and service requirements to contribute a portion
of their salary to certain investment trusts. Under the terms of the plan,
employer 401(k) contributions are made on behalf of the eligible employee
participants based on the employees’ 401(k) payroll deferrals. Effective January
1, 2007, the Plan was amended to incorporate the Safe Harbor method of meeting
nondiscrimination requirements of the Internal Revenue
Code. Beginning with the 2007 plan year, the employer contribution is
equal to 100% of the employee deferral on the first 3% of the employee pay
deferred and 50% of the employee deferral on the next 2% of the employee pay
deferred. Our expense associated with the Plan for the years ended December 31,
2009, 2008, and 2007 was approximately $2.7 million, $1.9 million, and $1.4
million, respectively.
In 2008,
we decided that employees should have an opportunity to diversify their 401(k)
accounts held in the Plan beginning with our 2008 Plan year. In January 2008,
employees were notified that they may elect to transfer any portion of their
401(k) accounts that is invested in VSE common stock from that investment into
another investment alternative under the Plan. This right extends to all of the
VSE common stock held under the 401(k) portion of the Plan. In addition, we
decided to terminate and liquidate the ESOP portion of the Plan and, as elected
by the employees, either distribute VSE common stock held in the ESOP
accounts to the employees or rollover such VSE common stock into an Individual
Retirement Account or employee plan selected by the employee. ESOP shares were
distributed to employees in the third quarter of 2008. The Plan held 54,475
shares and 95,499 shares of VSE common stock as of December 31, 2009 and 2008,
respectively. Such shares receive dividend payments and are included
in the weighted average shares for earnings per share calculations.
Energetics
maintains a profit sharing plan for its employees. All employees who
have completed two years of service are members of the profit sharing plan. At
our discretion, we may make contributions to the Energetics plan. Total expense
for the years ended December 31, 2009, 2008, and 2007 was $190 thousand, $240
thousand, and $227 thousand, respectively.
ICRC
sponsors a 401(k) profit sharing plan covering all ICRC regular status
employees. To be eligible to participate in the ICRC plan, an
employee must have completed one month of service with ICRC. The
discretionary employer contributions are immediately vested. Amounts
charged to operations for employer contributions for the years ended December
31, 2009, 2008 and the post-acquisition period of 2007 were approximately $222
thousand, $286 thousand and $378 thousand, respectively.
G&B
maintains a defined contribution retirement plan, established under the
provisions of Internal Revenue Code Section 401(k), covering substantially all
employees. Participants may make voluntary contributions up to the
maximum amount allowable by law. We match a percentage of the amount
contributed by each participant to comply with safe harbor
methods. At its discretion, we may make an additional profit sharing
contribution for participants who have completed one year of
service. The amount charged to operations for employer contributions
for 2009 and the post acquisition period of April 14, 2008 through December 31,
2008 was approximately $554 thousand and $334 thousand,
respectively.
(15) Fair
Value Measurements
The
accounting standard for fair value measurements defines fair value, establishes
a market-based framework or hierarchy for measuring fair value, and expends
disclosures about fair value measurements. The standard is applicable
whenever assets and liabilities are measured at fair
value.
59
The
fair-value hierarchy established in the standard prioritizes the inputs used in
valuation techniques into three levels as follows:
Level 1 –
Observable inputs – quoted prices in active markets for identical assets and
liabilities;
Level 2 –
Observable inputs other than the quoted prices in active markets for identical
assets and liabilities – includes quoted prices for similar instruments, quoted
prices for identical or similar instruments in inactive markets, and amounts
derived from valuation models where all significant inputs are observable in
active markets; and
Level 3 –
Unobservable inputs – includes amounts derived from valuation models where one
or more significant inputs are unobservable and require us to develop relevant
assumptions.
Included
in other current assets and other long-term assets as of December 31, 2009 and
2008 is approximately $4.8 million and $3.3 million, respectively, of
investments we hold in a rabbi trust related to the deferred supplemental
compensation plan. We determined the fair value of these assets and
corresponding liability using the Level 1 methodology. We have an
offsetting deferred compensation liability for this plan in long-term
liabilities. As such, we do not have income statement volatility as a
result of fluctuations in the value of the plan’s investments. In the first
quarter of 2009, we adopted the provision of the accounting standard for fair
value as it relates to non-financial assets and liabilities that are recorded at
fair value on a non-recurring basis. The impact of this adoption was
not material.
(16) Selected
Quarterly Data (Unaudited)
The
following table shows selected quarterly data for 2009 and 2008, in thousands,
except earnings per share:
|
2009 Quarters
|
||||||||||||||||
|
1st
|
2nd
|
3rd
|
4th
|
|||||||||||||
|
Revenues
|
$ | 240,455 | $ | 255,109 | $ | 263,068 | $ | 256,007 | ||||||||
|
Gross
profit
|
$ | 7,646 | $ | 10,669 | $ | 12,924 | $ | 8,503 | ||||||||
|
Net
income
|
$ | 4,640 | $ | 6,442 | $ | 7,726 | $ | 5,216 | ||||||||
|
Basic
earnings per share
|
$ | 0.91 | $ | 1.26 | $ | 1.51 | $ | 1.02 | ||||||||
|
Weighted
average shares outstanding
|
5,112 | 5,130 | 5,132 | 5,138 | ||||||||||||
|
Diluted
earnings per share
|
$ | 0.91 | $ | 1.25 | $ | 1.50 | $ | 1.01 | ||||||||
|
Weighted
average shares outstanding
|
5,127 | 5,143 | 5,146 | 5,169 | ||||||||||||
The
increase in profitability during the third quarter of 2009 was primarily
attributable to the conclusion of negotiations on our Treasury Seized Asset
Program that finalized target cost levels for the fiscal year ending September
30, 2009. This allowed us to recognize incentive fees in the third quarter of
2009 on all of our work performed during the government’s fiscal year ended
September 30, 2009. We recognized pretax income on this program in the third
quarter of 2009 of approximately $3.3 million, primarily due to this incentive
fee recognition.
60
|
2008 Quarters
|
||||||||||||||||
|
1st
|
2nd
|
3rd
|
4th
|
|||||||||||||
|
Revenues
|
$ | 188,723 | $ | 251,688 | $ | 306,811 | $ | 296,513 | ||||||||
|
Gross
profit
|
$ | 5,907 | $ | 8,049 | $ | 9,021 | $ | 9,350 | ||||||||
|
Net
income
|
$ | 3,598 | $ | 4,769 | $ | 5,309 | $ | 5,364 | ||||||||
|
Basic
earnings per share
|
$ | 0.71 | $ | 0.94 | $ | 1.05 | $ | 1.05 | ||||||||
|
Weighted
average shares outstanding
|
5,059 | 5,066 | 5,076 | 5,088 | ||||||||||||
|
Diluted
earnings per share
|
$ | 0.71 | $ | 0.94 | $ | 1.04 | $ | 1.05 | ||||||||
|
Weighted
average shares outstanding
|
5,087 | 5,095 | 5,100 | 5,104 | ||||||||||||
ITEM
9. Changes in and Disagreements with Accountants on
Accounting and
Financial
Disclosure
None.
ITEM
9A. CONTROLS AND PROCEDURES
Evaluation
of Disclosure Controls and Procedures
Our
management has evaluated, with the participation of our Chief Executive Officer
and Chief Financial Officer, the effectiveness of our disclosure controls and
procedures (as defined in Rules 13a-15(e) and 15d-15(e) under the Securities
Exchange Act of 1934, as amended (Exchange Act). Based on this evaluation, our
Chief Executive Officer and Chief Financial Officer have concluded that, as of
such date, our disclosure controls and procedures were effective to ensure that
information we are required to disclose in reports that we file or submit under
the Exchange Act is recorded, processed, summarized and reported within the time
periods specified in Securities and Exchange Commission rules and forms and that
such information is accumulated and communicated to our management, including
our Chief Executive Officer and Chief Financial Officer, as appropriate, to
allow timely decisions regarding required disclosure.
Management’s
Report on Internal Control Over Financial Reporting
Management
is responsible for establishing and maintaining adequate internal control over
financial reporting, as such term is defined in Exchange Act
Rules 13a-15(f) and 15d-15(f). Under the supervision and with the
participation of our management, including our Chief Executive Officer and Chief
Financial Officer, we conducted an assessment of the effectiveness of our
internal control over financial reporting as of December 31, 2009 based on the
framework in Internal Control
– Integrated Framework issued by the Committee of Sponsoring
Organizations of the Treadway Commission. Based on our assessment under the
framework in Internal Control
– Integrated Framework, our management concluded that our internal
control over financial reporting was effective as of December 31, 2009.
Ernst & Young LLP, our independent registered public accounting firm, has
issued an opinion on our internal control over financial reporting. This opinion
appears in the Report of Independent Registered Public Accounting Firm under
Item 9(a) of this Annual Report on Form 10-K.
Change
in Internal Controls
During
the fourth quarter of fiscal year 2009, there were no changes in our internal
control over financial reporting (as defined in Rules 13a-15(f) and
15d-15(f) under the Securities Exchange Act of 1934, as amended) that have
materially affected these controls, or are reasonably likely to materially
affect these controls subsequent to the evaluation of these controls.
61
Report
of Independent Registered Public Accounting Firm
The
Board of Directors and Stockholders of VSE Corporation
We have
audited VSE Corporation’s internal control over financial reporting as of
December 31, 2009, based on criteria established in Internal Control—Integrated
Framework issued by the Committee of Sponsoring Organizations of the Treadway
Commission (the COSO criteria). VSE Corporation’s management is responsible for
maintaining effective internal control over financial reporting, and for its
assessment of the effectiveness of internal control over financial reporting
included in the accompanying Management’s Report on Internal Control over
Financial Reporting. Our responsibility is to express an opinion on the
company’s internal control over financial reporting based on our audit.
We
conducted our audit in accordance with the standards of the Public Company
Accounting Oversight Board (United States). Those standards require that we plan
and perform the audit to obtain reasonable assurance about whether effective
internal control over financial reporting was maintained in all material
respects. Our audit included obtaining an understanding of internal control over
financial reporting, assessing the risk that a material weakness exists, testing
and evaluating the design and operating effectiveness of internal control based
on the assessed risk, and performing such other procedures as we considered
necessary in the circumstances. We believe that our audit provides a reasonable
basis for our opinion.
A
company’s internal control over financial reporting is a process designed to
provide reasonable assurance regarding the reliability of financial reporting
and the preparation of financial statements for external purposes in accordance
with generally accepted accounting principles. A company’s internal control over
financial reporting includes those policies and procedures that (1) pertain to
the maintenance of records that, in reasonable detail, accurately and fairly
reflect the transactions and dispositions of the assets of the company; (2)
provide reasonable assurance that transactions are recorded as necessary to
permit preparation of financial statements in accordance with generally accepted
accounting principles, and that receipts and expenditures of the company are
being made only in accordance with authorizations of management and directors of
the company; and (3) provide reasonable assurance regarding prevention or timely
detection of unauthorized acquisition, use, or disposition of the company’s
assets that could have a material effect on the financial
statements.
Because
of its inherent limitations, internal control over financial reporting may not
prevent or detect misstatements. Also, projections of any evaluation
of effectiveness to future periods are subject to the risk that controls may
become inadequate because of changes in conditions, or that the degree of
compliance with the policies or procedures may deteriorate.
In our
opinion, VSE Corporation maintained, in all material respects, effective
internal control over financial reporting as of December 31, 2009, based on the COSO criteria.
We also
have audited, in accordance with the standards of the Public Company Accounting
Oversight Board (United States), the consolidated balance sheets of VSE
Corporation and subsidiaries as of December 31, 2009 and 2008, and the related
consolidated statements of income, stockholders’ equity, and cash flows for each
of the three years in the period ended December 31, 2009 and our report dated
March 4, 2010 expressed an unqualified opinion thereon.
/s/ Ernst
& Young LLP
McLean,
VA
March 4,
2010
62
ITEM
9B.Other Information
None.
PART
III
Except as otherwise indicated below,
the information required by Items 10, 11, 12, 13 and 14 of Part III of Form 10-K
has been omitted in reliance of General Instruction G(3) to Form 10-K and is
incorporated herein by reference to our definitive proxy statement to be filed
with the SEC not later than 120 days after December 31, 2009 in respect to the
Annual Meeting of VSE’s stockholders (the “Proxy Statement”) scheduled to be
held on May 4, 2010.
ITEM
10. Directors, Executive Officers and Corporate
Governance
See Item
4 under the caption “Executive Officers of the Registrant,“ and the remaining
information required by this Item is incorporated by reference to the Proxy
Statement.
ITEM
11. Executive Compensation
The
information required by this Item is incorporated by reference to the
Proxy Statement.
ITEM
12. Security Ownership of Certain Beneficial Owners and
Management and
Related Stockholder Matters
Except
for the “Equity Compensation Plan Information” disclosed in Item 5(d) above, the
information required by this Item is incorporated by reference to the Proxy
Statement.
ITEM
13. Certain Relationships and Related Transactions, and
Director
Independence
The
information required by this Item is incorporated by reference to the Proxy
Statement.
ITEM
14. Principal Accountant Fees and Services
The
information required by this Item is incorporated by reference to the Proxy
Statement.
PART
IV
ITEM
15. Exhibits, Financial Statement Schedules
1.Financial Statements
The consolidated financial statements
are listed under Item 8 of this Form 10-K.
2.Supplemental Financial Statement
Schedules
Schedules
not included herein have been omitted because of the absence of conditions under
which they are required or because the required information, where material, is
shown in the consolidated financial statements or notes to the consolidated
financial statements.
63
3.Exhibits
See “Exhibit Index” hereinafter
contained and incorporated by reference.
64
SIGNATURES
Pursuant
to the requirements of Section 13 or 15(d) of the Securities Exchange Act
of 1934, the Registrant has duly caused this report to be signed on its behalf
by the undersigned, thereunto duly authorized.
|
VSE
CORPORATION
|
||
|
Date:
March 3,
2010
|
By:
|
/s/ M. A. Gauthier |
|
M.
A. Gauthier
|
||
|
Director,
Chief Executive Officer,
|
||
|
President
and Chief Operating
|
||
|
Officer
|
Pursuant
to the requirements of the Securities Exchange Act of 1934, this report has been
signed by the following persons on behalf of the Registrant and in the
capacities and on the dates indicated.
|
Name
|
Title
|
Date
|
|
/s/
Maurice A. Gauthier
|
Director,
Chief Executive Officer,
President and
|
March
3, 2010
|
|
Maurice
A. Gauthier
|
Chief Operating Officer | |
|
/s/
Thomas R. Loftus
|
Executive
Vice President and Chief Financial Officer
|
March
3, 2010
|
|
Thomas
R. Loftus
|
(Principal
Financial and Accounting Officer)
|
|
|
|
||
|
/s/ Donald M.
Ervine
|
Chairman
|
March
3, 2010
|
|
Donald
M. Ervine
|
||
|
/s/
Clifford M. Kendall
|
Director
|
March
3, 2010
|
|
Clifford
M. Kendall
|
||
|
/s/
Calvin S. Koonce
|
Director
|
March
3, 2010
|
|
Calvin
S. Koonce
|
||
|
/s/
James F. Lafond
|
Director
|
March
3, 2010
|
|
James
F. Lafond
|
||
|
/s/
David M. Osnos
|
Director
|
March
3, 2010
|
|
David
M. Osnos
|
||
|
/s/
Jimmy D. Ross
|
Director
|
March
3, 2010
|
|
Jimmy
D. Ross
|
||
|
/s/
Bonnie K. Wachtel
|
Director
|
March
3, 2010
|
|
Bonnie
K. Wachtel
|
||
|
/s/
Ralph E. Eberhart
|
Director
|
March
3, 2010
|
|
Ralph
E. Eberhart
|
65
|
EXHIBIT INDEX
|
||
|
Reference
No.
Per
Item 601 of
Regulation S-K
|
Description of Exhibit
|
Exhibit
No.
In
this Form 10-K
|
|
2.1
|
Plan
of acquisition, reorganization, arrangement, liquidation
or succession Share
Purchase Agreement, dated as of June 4,2007,
by and among VSE Corporation, Koniag, Inc.,
Koniag Development Corporation, Nancy Ellen
Lexo Living Trust, James W. Lexo, Jr., and Integrated
Concepts and Research Corporation (Exhibit
2.1 to Form 8-K dated June 4, 2007)
|
*
|
|
2.2
|
Share
Purchase Agreement, dated as of April 14, 2008,by
and among VSE Corporation, Linda Kay Berdine Revocable
Trust, Linda K. Berdine and G&B
Solutions, Inc. (Exhibit 2.1 to Form 8-K dated April
14, 2008)
|
*
|
|
3.1
|
Certificate
of incorporation and
by-laws
Restated
Certificate of Incorporation of VSE Corporation
dated as of February 6, 1996 (Exhibit 3.2
to Form 10-K405 dated March 25, 1996)
|
*
|
|
3.2
|
By-Laws
of VSE Corporation as amended through December
17, 2008 (Exhibit 3.1 to Form 8-K dated December
17, 2008)
|
*
|
|
4.1
|
Instruments
defining the rights of security holders, including
indentures
Specimen
Stock Certificate as of May 19, 1983 (Exhibit
4 to Registration Statement No. 2-83255 dated
April 22, 1983 on Form S-2)
|
* +
|
|
10.1
|
Material
contracts
|
|
|
10.2
|
Employment
Agreement dated as of March 10, 2004, by
and between VSE Corporation and Thomas G.Dacus
(Exhibit 10.1 to Form 10-Q dated April 28, 2004)
|
* +
|
|
10.3
|
Employment
Agreement dated as of July 1, 2004, by
and between VSE Corporation and Thomas R. Loftus (Exhibit
10.1 to Form 10-Q dated July 30, 2004)
|
* +
|
|
10.4
|
Employment
Agreement dated as of April 22, 2008,
by and between VSE Corporation and Maurice
G. Gauthier (Exhibit 10.1 to Form 8-K dated
April 22, 2008)
|
* +
|
|
10.5
|
Transition
Agreement dated as of April 22, 2008,
by and between VSE Corporation and Donald
M. Ervine (Exhibit 10.2 to Form 8-K dated April
22, 2008)
|
* +
|
|
10.6
|
Severance
and Mutual Protection Agreement dated
as of November 7, 2008 by and between VSE
Corporation and Thomas M. Kiernan (Exhibit
10.3 to Form 10-K dated
March
3, 2009)
|
* +
|
|
10.7
|
Statement
of Amendment Number One to the Transition
agreement, dated December 30,2008 between
VSE Corporation and Donald M. Ervine (Exhibit
10.1 to Form 8-K dated January 6, 2009)
|
* +
|
66
|
10.8
|
Statement
of Amendment Number Two to the Transition
Agreement, dated December 31, 2008, between
VSE Corporation and Donald M. Ervine (Exhibit
10.2 to Form 8-K dated
January
6, 2009)
|
* +
|
|
10.9
|
Business
Loan and security Agreement dated August
26, 2009 among VSE Corporation, Energetics
Incorporated, VSE Services International,
Inc., Integrated Concepts and
Research
Corporation, G&B Solutions, Inc., Citizens
Bank of Pennsylvania and Suntrust Bank
(Exhibit 10.1 to Form 8-K dated August 26, 2009)
|
* +
|
|
10.10
|
Lease
Agreement by and between Metropark 7 LLC and VSE
Corporation (Exhibit 10.2 to Form 8-K dated November
4, 2009)
|
* +
|
|
10.11
|
VSE
Corporation Deferred Supplemental Compensation Plan
effective January 1, 1994 as amended by the Board
through March 9, 2004 (Exhibit 10.2 to Form
10-Q dated April 28, 2004)
|
* +
|
|
10.12
|
VSE
Corporation 2004 Stock Option Plan (Appendix
B to Registrant’s definitive proxy statement
for the Annual Meeting of Stockholders
held on May 3, 2004)
|
* +
|
|
10.13
|
VSE
Corporation 2004 Non-employee Directors Stock Plan
(Appendix C to Registrant’s definitive proxy
statement for the Annual Meeting of Stockholders
held on May 3, 2004)
|
* +
|
|
13.1
|
Annual
report to security holders, Form 10-Q or
selected quarterly data
|
Exhibit
13
|
|
21.1
|
Subsidiaries
of the Registrant
|
Exhibit
21
|
|
23.1
|
Consent
of Ernst & Young LLP, independent registered
public accounting firm
|
Exhibit
23.1
|
|
31.1
|
Section
302 CEO Certification
|
Exhibit
31.1
|
|
31.2
|
Section
302 CFO and PAO Certification
|
Exhibit
31.2
|
|
32.1
|
Section
906 CEO Certification
|
Exhibit
32.1
|
|
32.2
|
Section
906 CFO and PAO Certification
|
Exhibit
32.2
|
|
99.1
|
Audit
Committee Charter (as adopted by the Board Of
Directors of VSE Corporation on March 9, 2004)(Appendix
A to Registrant’s definitive proxy
statement for the Annual Meeting of
Stockholders
held on May 3, 2004)
|
*
|
*Document
has been filed as indicated and is incorporated by reference
herein.
+Indicates
management contract or compensatory plan or arrangement.
67